

490
Multiscale Hydrologic Remote Sensing: Perspectives and Applications
datasets (from three data centers and each with three smoothing resolutions: 0, 300,
and 500 km) are plotted with their averages plotted as black circles. GRACE data
are known to have a resonance problem from July to October 2004 as can be seen in
this figure. In 2004, a resonance caused the satellite to enter a near-repeat orbit (see
the work of Wagner et al. [2006] for details). As observed, the differences among
different GRACE data are small because of the relatively large size of selected river
basins. However, a large disparity in the amplitude of seasonal TWS variations can
be observed, ranging from ~20 mm in the Amur and Murray–Darling River basins
to ~200 mm in the Amazon and Brahmaputra basins.
20.4.2 illinoiS IN SITu oBSeRvationS
The in situ data used in this chapter include 25-year (1985–2009) monthly time
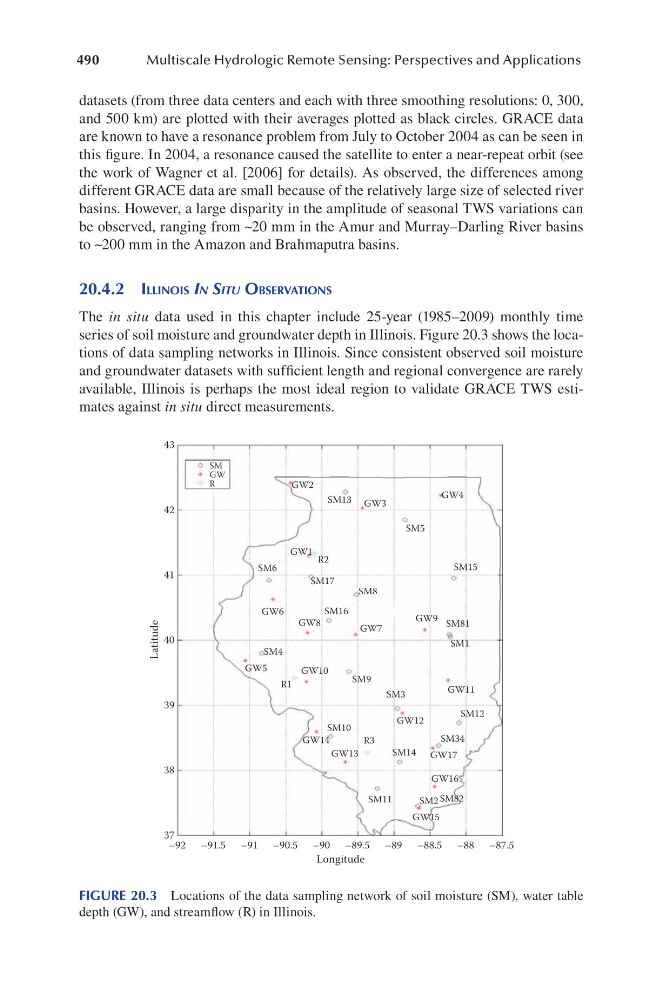
series of soil moisture and groundwater depth in Illinois. Figure 20.3 shows the locations of data sampling networks in Illinois. Since consistent observed soil moisture
and groundwater datasets with sufficient length and regional convergence are rarely
available, Illinois is perhaps the most ideal region to validate GRACE TWS estimates against in situ direct measurements.
43
GW2
SM13
SM5
SM15
R2
R1
R3
SM8
SM16
SM17
SM6
SM4
SM9
SM3
SM1
SM81
SM12
SM34
SM14
SM10
SM11
SM2 SM82
GW3
GW4
GW1
GW6
GW8
GW7
GW9
GW5
GW10
GW11
GW12
GW14
GW13
GW17
GW16
GW15
42
41
40
39
38
37
–92 –91.5 –91 –90.5 –90 –89.5 –89 –88.5 –88 –87.5
Latitude
Longitude
SM
GW
R
FIGURE 20.3 Locations of the data sampling network of soil moisture (SM), water table
depth (GW), and streamflow (R) in Illinois.
Multiscale Hydrologic Remote Sensing: Perspectives and Applications
datasets (from three data centers and each with three smoothing resolutions: 0, 300,
and 500 km) are plotted with their averages plotted as black circles. GRACE data
are known to have a resonance problem from July to October 2004 as can be seen in
this figure. In 2004, a resonance caused the satellite to enter a near-repeat orbit (see
the work of Wagner et al. [2006] for details). As observed, the differences among
different GRACE data are small because of the relatively large size of selected river
basins. However, a large disparity in the amplitude of seasonal TWS variations can
be observed, ranging from ~20 mm in the Amur and Murray–Darling River basins
to ~200 mm in the Amazon and Brahmaputra basins.
20.4.2 illinoiS IN SITu oBSeRvationS
The in situ data used in this chapter include 25-year (1985–2009) monthly time
series of soil moisture and groundwater depth in Illinois. Figure 20.3 shows the locations of data sampling networks in Illinois. Since consistent observed soil moisture
and groundwater datasets with sufficient length and regional convergence are rarely
available, Illinois is perhaps the most ideal region to validate GRACE TWS estimates against in situ direct measurements.
43
GW2
SM13
SM5
SM15
R2
R1
R3
SM8
SM16
SM17
SM6
SM4
SM9
SM3
SM1
SM81
SM12
SM34
SM14
SM10
SM11
SM2 SM82
GW3
GW4
GW1
GW6
GW8
GW7
GW9
GW5
GW10
GW11
GW12
GW14
GW13
GW17
GW16
GW15
42
41
40
39
38
37
–92 –91.5 –91 –90.5 –90 –89.5 –89 –88.5 –88 –87.5
Latitude
Longitude
SM
GW
R
FIGURE 20.3 Locations of the data sampling network of soil moisture (SM), water table
depth (GW), and streamflow (R) in Illinois.