

456
Multiscale Hydrologic Remote Sensing: Perspectives and Applications
be replaced by the closest reliable 8-day (16-day) value. This step ensures that the
second step can be performed, in which other unreliable LAI (NDVI, EVI) will be
replaced by linear interpolation of the nearest reliable values before and after the
missing data point.
For MODIS albedo, the 10th band of the white-sky albedo from the 0.05° 16-day
MOD43C1 bidirectional reflectance distribution function (BRDF) products was used
(Schaaf et al. 2002). This MODIS albedo is used to calculate reflected solar radiation
and, hence, the net incoming solar radiation. The unreliable or missing albedo data
are also temporally filled with the method proposed by Zhao et al. (2005).
Since Collection 4 MODIS data do not have a 0.05° global EVI product, the 0.05°
global EVI (Equation 19.8) (Huete et al. 2002, 2006) is calculated using the 0.05°
MODIS 43C3 BRDF quality-controlled surface reflectance. Then, EVI gaps are
filled due to unreliable or missing BRDF reflectance with the method proposed by
Zhao et al. (2005).
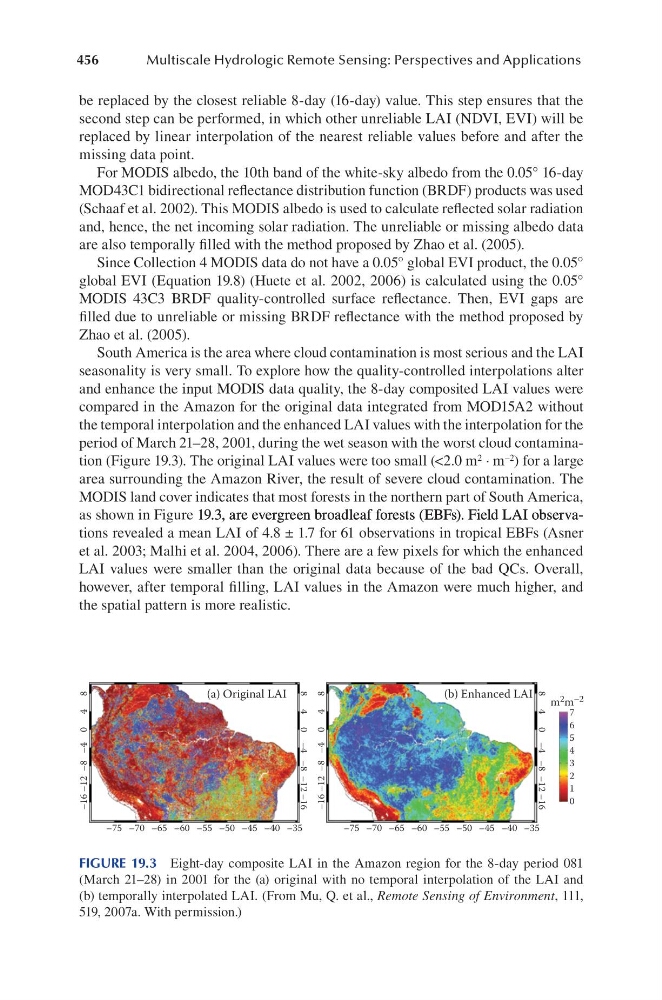
South America is the area where cloud contamination is most serious and the LAI
seasonality is very small. To explore how the quality-controlled interpolations alter
and enhance the input MODIS data quality, the 8-day composited LAI values were
compared in the Amazon for the original data integrated from MOD15A2 without
the temporal interpolation and the enhanced LAI values with the interpolation for the
period of March 21–28, 2001, during the wet season with the worst cloud contamination (Figure 19.3). The original LAI values were too small (<2.0 m 2 ∙ m –2 ) for a large
area surrounding the Amazon River, the result of severe cloud contamination. The
MODIS land cover indicates that most forests in the northern part of South America,
as shown in Figure 19.3, are evergreen broadleaf forests (EBFs). Field LAI observa19.3, are evergreen broadleaf forests (EBFs). Field LAI observa.3, are evergreen broadleaf forests (EBFs). Field LAI observations revealed a mean LAI of 4.8 ± 1.7 for 61 observations in tropical EBFs (Asner
et al. 2003; Malhi et al. 2004, 2006). There are a few pixels for which the enhanced
LAI values were smaller than the original data because of the bad QCs. Overall,
however, after temporal filling, LAI values in the Amazon were much higher, and
the spatial pattern is more realistic.
–16
–75 –70 –65 –60 –55 –50 –45 –40
(a) Original LAI
(b) Enhanced LAI
–35
–75 –70 –65 –60 –55 –50 –45 –40 –35
–12 –8 –4 0 4 8
–16
–12
–8
–4
0
4
8
–16
–12
–8
–4
0
4
8
–16 –12 –8 –4 0 4 8
m 2 m –2
7
6
5
4
3
2
1
0
FIGURE 19.3 Eight-day composite LAI in the Amazon region for the 8-day period 081
(March 21–28) in 2001 for the (a) original with no temporal interpolation of the LAI and
(b) temporally interpolated LAI. (From Mu, Q. et al., Remote Sensing of Environment, 111,
519, 2007a. With permission.)
Multiscale Hydrologic Remote Sensing: Perspectives and Applications
be replaced by the closest reliable 8-day (16-day) value. This step ensures that the
second step can be performed, in which other unreliable LAI (NDVI, EVI) will be
replaced by linear interpolation of the nearest reliable values before and after the
missing data point.
For MODIS albedo, the 10th band of the white-sky albedo from the 0.05° 16-day
MOD43C1 bidirectional reflectance distribution function (BRDF) products was used
(Schaaf et al. 2002). This MODIS albedo is used to calculate reflected solar radiation
and, hence, the net incoming solar radiation. The unreliable or missing albedo data
are also temporally filled with the method proposed by Zhao et al. (2005).
Since Collection 4 MODIS data do not have a 0.05° global EVI product, the 0.05°
global EVI (Equation 19.8) (Huete et al. 2002, 2006) is calculated using the 0.05°
MODIS 43C3 BRDF quality-controlled surface reflectance. Then, EVI gaps are
filled due to unreliable or missing BRDF reflectance with the method proposed by
Zhao et al. (2005).
South America is the area where cloud contamination is most serious and the LAI
seasonality is very small. To explore how the quality-controlled interpolations alter
and enhance the input MODIS data quality, the 8-day composited LAI values were
compared in the Amazon for the original data integrated from MOD15A2 without
the temporal interpolation and the enhanced LAI values with the interpolation for the
period of March 21–28, 2001, during the wet season with the worst cloud contamination (Figure 19.3). The original LAI values were too small (<2.0 m 2 ∙ m –2 ) for a large
area surrounding the Amazon River, the result of severe cloud contamination. The
MODIS land cover indicates that most forests in the northern part of South America,
as shown in Figure 19.3, are evergreen broadleaf forests (EBFs). Field LAI observa19.3, are evergreen broadleaf forests (EBFs). Field LAI observa.3, are evergreen broadleaf forests (EBFs). Field LAI observations revealed a mean LAI of 4.8 ± 1.7 for 61 observations in tropical EBFs (Asner
et al. 2003; Malhi et al. 2004, 2006). There are a few pixels for which the enhanced
LAI values were smaller than the original data because of the bad QCs. Overall,
however, after temporal filling, LAI values in the Amazon were much higher, and
the spatial pattern is more realistic.
–16
–75 –70 –65 –60 –55 –50 –45 –40
(a) Original LAI
(b) Enhanced LAI
–35
–75 –70 –65 –60 –55 –50 –45 –40 –35
–12 –8 –4 0 4 8
–16
–12
–8
–4
0
4
8
–16
–12
–8
–4
0
4
8
–16 –12 –8 –4 0 4 8
m 2 m –2
7
6
5
4
3
2
1
0
FIGURE 19.3 Eight-day composite LAI in the Amazon region for the 8-day period 081
(March 21–28) in 2001 for the (a) original with no temporal interpolation of the LAI and
(b) temporally interpolated LAI. (From Mu, Q. et al., Remote Sensing of Environment, 111,
519, 2007a. With permission.)