

454
Multiscale Hydrologic Remote Sensing: Perspectives and Applications
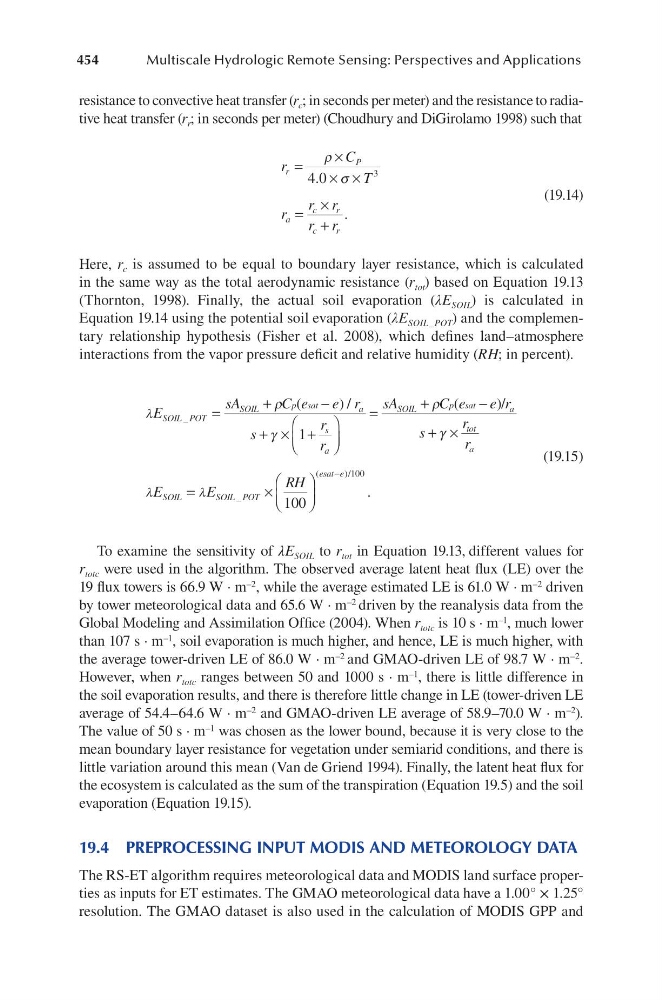
resistance to convective heat transfer (r c ; in seconds per meter) and the resistance to radiative heat transfer (r r ; in seconds per meter) (Choudhury and DiGirolamo 1998) such that
r
C
T
r
r r
r r
r
P
a
c
r
c
r
=
×
× ×
=
×
+
ρ
σ
4 0
3
.
.
(19.14)
Here, r c is assumed to be equal to boundary layer resistance, which is calculated
in the same way as the total aerodynamic resistance (r tot ) based on Equation 19.13
(Thornton, 1998). Finally, the actual soil evaporation (λE SOIL ) is calculated in
Equation 19.14 using the potential soil evaporation (λE SOIL_POT ) and the complementary relationship hypothesis (Fisher et al. 2008), which defines land–atmosphere
interactions from the vapor pressure deficit and relative humidity (RH; in percent).
λ
ρ
γ
E
sA
C e
e r
s
r
r
SOIL POT
SOIL
p sat
a
s
a
_
(
) /
=
+
−
+ × +
1
=
+
−
+ ×
=
sA
C e
e r
s
r
r
E
E
SOIL
p sat
a
tot
a
SOIL
SOIL
ρ
γ
λ
λ
(
)/
_ _
(
)/
.
POT
esat e
RH
×
−
100
100
(19.15)
To examine the sensitivity of λE SOIL to r tot in Equation 19.13, different values for
r totc were used in the algorithm. The observed average latent heat flux (LE) over the
19 flux towers is 66.9 W ∙ m –2 , while the average estimated LE is 61.0 W ∙ m –2 driven
by tower meteorological data and 65.6 W ∙ m –2 driven by the reanalysis data from the
Global Modeling and Assimilation Office (2004). When r totc is 10 s ∙ m –1 , much lower
than 107 s ∙ m –1 , soil evaporation is much higher, and hence, LE is much higher, with
the average tower-driven LE of 86.0 W ∙ m –2 and GMAO-driven LE of 98.7 W ∙ m –2 .
However, when r totc ranges between 50 and 1000 s ∙ m –1 , there is little difference in
the soil evaporation results, and there is therefore little change in LE (tower-driven LE
average of 54.4–64.6 W ∙ m –2 and GMAO-driven LE average of 58.9–70.0 W ∙ m –2 ).
The value of 50 s ∙ m –1 was chosen as the lower bound, because it is very close to the
mean boundary layer resistance for vegetation under semiarid conditions, and there is
little variation around this mean (Van de Griend 1994). Finally, the latent heat flux for
the ecosystem is calculated as the sum of the transpiration (Equation 19.5) and the soil
evaporation (Equation 19.15).
19.4 PREPROCESSING INPUT MODIS AND METEOROLOGY DATA
The RS-ET algorithm requires meteorological data and MODIS land surface properties as inputs for ET estimates. The GMAO meteorological data have a 1.00° × 1.25°
resolution. The GMAO dataset is also used in the calculation of MODIS GPP and
Multiscale Hydrologic Remote Sensing: Perspectives and Applications
resistance to convective heat transfer (r c ; in seconds per meter) and the resistance to radiative heat transfer (r r ; in seconds per meter) (Choudhury and DiGirolamo 1998) such that
r
C
T
r
r r
r r
r
P
a
c
r
c
r
=
×
× ×
=
×
+
ρ
σ
4 0
3
.
.
(19.14)
Here, r c is assumed to be equal to boundary layer resistance, which is calculated
in the same way as the total aerodynamic resistance (r tot ) based on Equation 19.13
(Thornton, 1998). Finally, the actual soil evaporation (λE SOIL ) is calculated in
Equation 19.14 using the potential soil evaporation (λE SOIL_POT ) and the complementary relationship hypothesis (Fisher et al. 2008), which defines land–atmosphere
interactions from the vapor pressure deficit and relative humidity (RH; in percent).
λ
ρ
γ
E
sA
C e
e r
s
r
r
SOIL POT
SOIL
p sat
a
s
a
_
(
) /
=
+
−
+ × +
1
=
+
−
+ ×
=
sA
C e
e r
s
r
r
E
E
SOIL
p sat
a
tot
a
SOIL
SOIL
ρ
γ
λ
λ
(
)/
_ _
(
)/
.
POT
esat e
RH
×
−
100
100
(19.15)
To examine the sensitivity of λE SOIL to r tot in Equation 19.13, different values for
r totc were used in the algorithm. The observed average latent heat flux (LE) over the
19 flux towers is 66.9 W ∙ m –2 , while the average estimated LE is 61.0 W ∙ m –2 driven
by tower meteorological data and 65.6 W ∙ m –2 driven by the reanalysis data from the
Global Modeling and Assimilation Office (2004). When r totc is 10 s ∙ m –1 , much lower
than 107 s ∙ m –1 , soil evaporation is much higher, and hence, LE is much higher, with
the average tower-driven LE of 86.0 W ∙ m –2 and GMAO-driven LE of 98.7 W ∙ m –2 .
However, when r totc ranges between 50 and 1000 s ∙ m –1 , there is little difference in
the soil evaporation results, and there is therefore little change in LE (tower-driven LE
average of 54.4–64.6 W ∙ m –2 and GMAO-driven LE average of 58.9–70.0 W ∙ m –2 ).
The value of 50 s ∙ m –1 was chosen as the lower bound, because it is very close to the
mean boundary layer resistance for vegetation under semiarid conditions, and there is
little variation around this mean (Van de Griend 1994). Finally, the latent heat flux for
the ecosystem is calculated as the sum of the transpiration (Equation 19.5) and the soil
evaporation (Equation 19.15).
19.4 PREPROCESSING INPUT MODIS AND METEOROLOGY DATA
The RS-ET algorithm requires meteorological data and MODIS land surface properties as inputs for ET estimates. The GMAO meteorological data have a 1.00° × 1.25°
resolution. The GMAO dataset is also used in the calculation of MODIS GPP and