

323
Radar Polarimetry for Rain Estimation
could be calibrated through the comparison to reduce the effect of model error and/
or system bias.
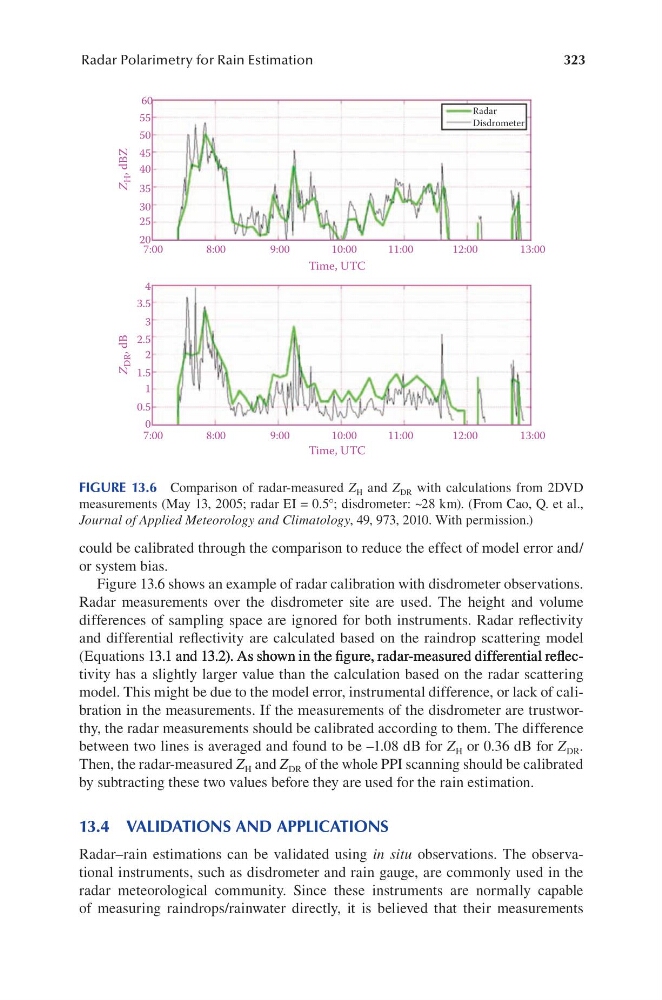
Figure 13.6 shows an example of radar calibration with disdrometer observations.
Radar measurements over the disdrometer site are used. The height and volume
differences of sampling space are ignored for both instruments. Radar reflectivity
and differential reflectivity are calculated based on the raindrop scattering model
(Equations 13.1 and 13.2). As shown in the fi gure, radar-measured differential refl ec3.1 and 13.2). As shown in the fi gure, radar-measured differential refl ec.1 and 13.2). As shown in the fi gure, radar-measured differential refl ec3.2). As shown in the fi gure, radar-measured differential refl ec.2). As shown in the figure, radar-measured differential reflectivity has a slightly larger value than the calculation based on the radar scattering
model. This might be due to the model error, instrumental difference, or lack of calibration in the measurements. If the measurements of the disdrometer are trustworthy, the radar measurements should be calibrated according to them. The difference
between two lines is averaged and found to be –1.08 dB for Z H or 0.36 dB for Z DR .
Then, the radar-measured Z H and Z DR of the whole PPI scanning should be calibrated
by subtracting these two values before they are used for the rain estimation.
13.4 VALIDATIONS AND APPLICATIONS
Radar–rain estimations can be validated using in situ observations. The observational instruments, such as disdrometer and rain gauge, are commonly used in the
radar meteorological community. Since these instruments are normally capable
of measuring raindrops/rainwater directly, it is believed that their measurements
60
55
45
35
25
20
7:00
8:00
9:00
10:00
11:00
Time, UTC
12:00
13:00
Radar
Disdrometer
7:00
8:00
9:00
10:00
11:00
Time, UTC
Z
H , dBZ
Z
DR , dB
12:00
13:00
4
3
2
1
0
3.5
2.5
1.5
0.5
30
50
40
FIGURE 13.6 Comparison of radar-measured Z H and Z DR with calculations from 2DVD
measurements (May 13, 2005; radar EI = 0.5°; disdrometer: ~28 km). (From Cao, Q. et al.,
Journal of Applied Meteorology and Climatology, 49, 973, 2010. With permission.)
Radar Polarimetry for Rain Estimation
could be calibrated through the comparison to reduce the effect of model error and/
or system bias.
Figure 13.6 shows an example of radar calibration with disdrometer observations.
Radar measurements over the disdrometer site are used. The height and volume
differences of sampling space are ignored for both instruments. Radar reflectivity
and differential reflectivity are calculated based on the raindrop scattering model
(Equations 13.1 and 13.2). As shown in the fi gure, radar-measured differential refl ec3.1 and 13.2). As shown in the fi gure, radar-measured differential refl ec.1 and 13.2). As shown in the fi gure, radar-measured differential refl ec3.2). As shown in the fi gure, radar-measured differential refl ec.2). As shown in the figure, radar-measured differential reflectivity has a slightly larger value than the calculation based on the radar scattering
model. This might be due to the model error, instrumental difference, or lack of calibration in the measurements. If the measurements of the disdrometer are trustworthy, the radar measurements should be calibrated according to them. The difference
between two lines is averaged and found to be –1.08 dB for Z H or 0.36 dB for Z DR .
Then, the radar-measured Z H and Z DR of the whole PPI scanning should be calibrated
by subtracting these two values before they are used for the rain estimation.
13.4 VALIDATIONS AND APPLICATIONS
Radar–rain estimations can be validated using in situ observations. The observational instruments, such as disdrometer and rain gauge, are commonly used in the
radar meteorological community. Since these instruments are normally capable
of measuring raindrops/rainwater directly, it is believed that their measurements
60
55
45
35
25
20
7:00
8:00
9:00
10:00
11:00
Time, UTC
12:00
13:00
Radar
Disdrometer
7:00
8:00
9:00
10:00
11:00
Time, UTC
Z
H , dBZ
Z
DR , dB
12:00
13:00
4
3
2
1
0
3.5
2.5
1.5
0.5
30
50
40
FIGURE 13.6 Comparison of radar-measured Z H and Z DR with calculations from 2DVD
measurements (May 13, 2005; radar EI = 0.5°; disdrometer: ~28 km). (From Cao, Q. et al.,
Journal of Applied Meteorology and Climatology, 49, 973, 2010. With permission.)