

288
Multiscale Hydrologic Remote Sensing: Perspectives and Applications
and warm seasons in the mountainous grid is because frozen precipitation is frequent
in the mountainous region and is challenging for both rain gauge and NEXRAD
measurements. In the southern plains (Figure 12.3), no substantial difference was
noted between the performance of NEXRAD in the warm and cold seasons. In most
cases, the NEXRAD estimated accumulated precipitation was about 80%–120% of
that observed by rain gauges, except for rain gauge P44 in the warm season of both
2003 and 2004. This may be because the temperature in the southern plains is higher
than zero in the cold season, leading to rare frozen precipitation events.
12.4.3 effect of SuBgRid heteRogeneity on nexRad PeRfoRMance
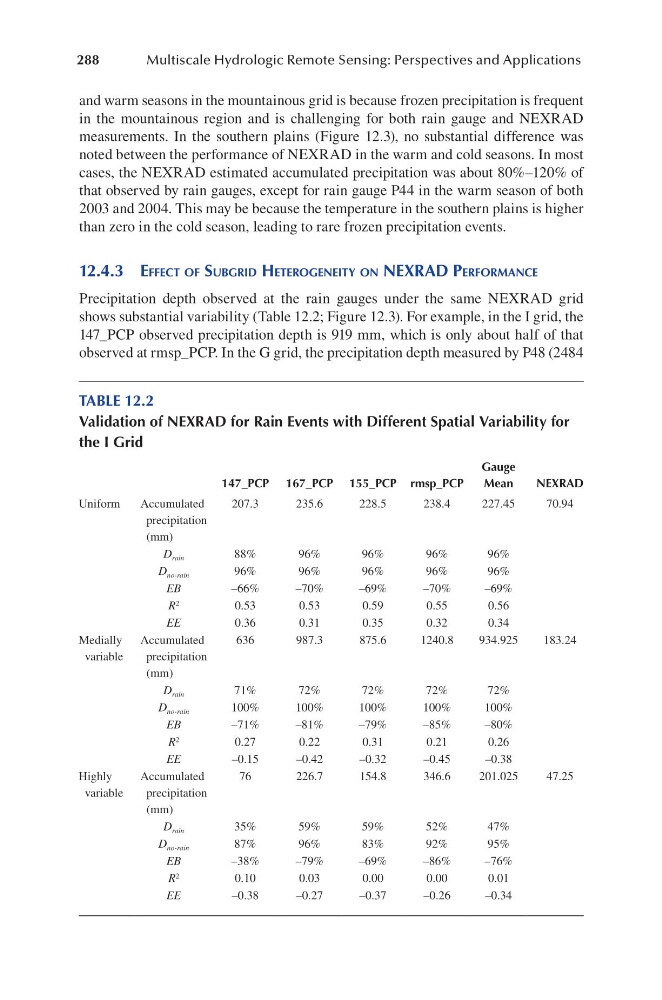
Precipitation depth observed at the rain gauges under the same NEXRAD grid
shows substantial variability (Table 12.2; Figure 12.3). For example, in the I grid, the
147_PCP observed precipitation depth is 919 mm, which is only about half of that
observed at rmsp_PCP. In the G grid, the precipitation depth measured by P48 (2484
TABLE 12.2
Validation of NEXRAD for Rain Events with Different Spatial Variability for
the I Grid
147_PCP 167_PCP 155_PCP rmsp_PCP
Gauge
Mean
NEXRAD
Uniform
Accumulated
precipitation
(mm)
207.3
235.6
228.5
238.4
227.45
70.94
D rain
88%
96%
96%
96%
96%
D no-rain
96%
96%
96%
96%
96%
EB
–66%
–70%
–69%
–70%
–69%
R 2
0.53
0.53
0.59
0.55
0.56
EE
0.36
0.31
0.35
0.32
0.34
Medially
variable
Accumulated
precipitation
(mm)
636
987.3
875.6
1240.8
934.925
183.24
D rain
71%
72%
72%
72%
72%
D no-rain
100%
100%
100%
100%
100%
EB
–71%
–81%
–79%
–85%
–80%
R 2
0.27
0.22
0.31
0.21
0.26
EE
–0.15
–0.42
–0.32
–0.45
–0.38
Highly
variable
Accumulated
precipitation
(mm)
76
226.7
154.8
346.6
201.025
47.25
D rain
35%
59%
59%
52%
47%
D no-rain
87%
96%
83%
92%
95%
EB
–38%
–79%
–69%
–86%
–76%
R 2
0.10
0.03
0.00
0.00
0.01
EE
–0.38
–0.27
–0.37
–0.26
–0.34
Multiscale Hydrologic Remote Sensing: Perspectives and Applications
and warm seasons in the mountainous grid is because frozen precipitation is frequent
in the mountainous region and is challenging for both rain gauge and NEXRAD
measurements. In the southern plains (Figure 12.3), no substantial difference was
noted between the performance of NEXRAD in the warm and cold seasons. In most
cases, the NEXRAD estimated accumulated precipitation was about 80%–120% of
that observed by rain gauges, except for rain gauge P44 in the warm season of both
2003 and 2004. This may be because the temperature in the southern plains is higher
than zero in the cold season, leading to rare frozen precipitation events.
12.4.3 effect of SuBgRid heteRogeneity on nexRad PeRfoRMance
Precipitation depth observed at the rain gauges under the same NEXRAD grid
shows substantial variability (Table 12.2; Figure 12.3). For example, in the I grid, the
147_PCP observed precipitation depth is 919 mm, which is only about half of that
observed at rmsp_PCP. In the G grid, the precipitation depth measured by P48 (2484
TABLE 12.2
Validation of NEXRAD for Rain Events with Different Spatial Variability for
the I Grid
147_PCP 167_PCP 155_PCP rmsp_PCP
Gauge
Mean
NEXRAD
Uniform
Accumulated
precipitation
(mm)
207.3
235.6
228.5
238.4
227.45
70.94
D rain
88%
96%
96%
96%
96%
D no-rain
96%
96%
96%
96%
96%
EB
–66%
–70%
–69%
–70%
–69%
R 2
0.53
0.53
0.59
0.55
0.56
EE
0.36
0.31
0.35
0.32
0.34
Medially
variable
Accumulated
precipitation
(mm)
636
987.3
875.6
1240.8
934.925
183.24
D rain
71%
72%
72%
72%
72%
D no-rain
100%
100%
100%
100%
100%
EB
–71%
–81%
–79%
–85%
–80%
R 2
0.27
0.22
0.31
0.21
0.26
EE
–0.15
–0.42
–0.32
–0.45
–0.38
Highly
variable
Accumulated
precipitation
(mm)
76
226.7
154.8
346.6
201.025
47.25
D rain
35%
59%
59%
52%
47%
D no-rain
87%
96%
83%
92%
95%
EB
–38%
–79%
–69%
–86%
–76%
R 2
0.10
0.03
0.00
0.00
0.01
EE
–0.38
–0.27
–0.37
–0.26
–0.34