

277
Precipitation Estimate Using NEXRAD Ground-Based Radar Images
3. Validation and calibration of NEXRAD data using rain gauge observations. NEXRAD-VC can identify the concurrent paired precipitation
records where both rain gauge observations and NEXRAD data are available. Using these pairs of records, different statistical evaluation coefficients
are calculated to evaluate the accuracy of NEXRAD data and the crossvalidation performance of different NEXRAD data calibration methods.
4. Multiple output files. NEXRAD data calibrated by different methods are
output in raster format, which can be easily visualized using ArcGIS or
other GIS software. The spatial average precipitation is derived for each
hydrologic unit and output in text format for distributed hydrologic and
ecological modeling. In addition, rain gauge observations, NEXRAD estimates, and calibrated NEXRAD values using the specified cross-validation
method are output in one text file for each rain gauge. These output files
allow users to validate the accuracy of NEXRAD data and evaluate the
performance of different calibration methods.
12.3.2 nexRad caliBRation algoRithMS in nexRad-vc
A number of spatial prediction techniques are available. Ordinary kriging (OK) and
simple kriging (SK) (Isaaks and Srivastava 1989) are two widely used univariate
Rain gauge point
shapefile
Hydrologic unit
polygon shapefile
Each rain gauge’s rainfall
records in text format
Input each time step’s rainfall to
the corresponding rain gauge point
Input and transform the format
of NEXRAD data into ArcGIS
grid format
Match projection and identify the pairs
of rain gauge observations and
NEXRAD estimates
Extract precipitation for
each hydrologic unit
Validate NEXRAD using
rain gauge data
Calibrate NEXRAD using
rain gauge data
Spatial average
precipitation for each
hydrologic unit
Spatial precipitation map in the ArcGIS grid format
Evaluation coefficients (e.g., detecting capability,
estimation bias, correlation coefficient, estimation
efficiency, and ratio of variance)
NEXRAD data in
compressed binary or
NETCDF format
Input data
Data processing
functions
Output
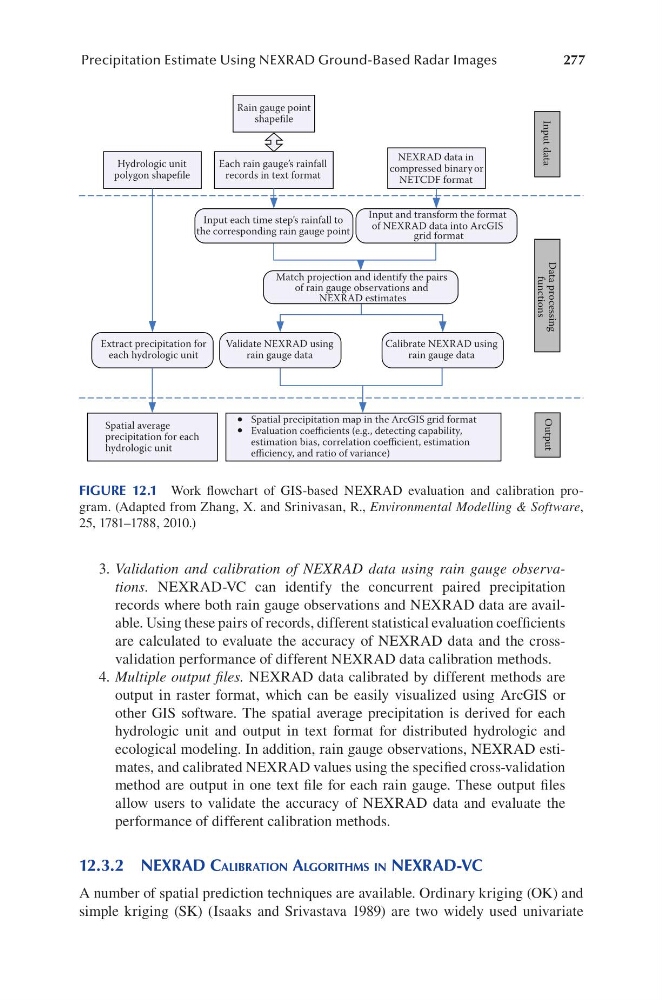
FIGURE 12.1 Work flowchart of GIS-based NEXRAD evaluation and calibration program. (Adapted from Zhang, X. and Srinivasan, R., Environmental Modelling & Software,
25, 1781–1788, 2010.)
Precipitation Estimate Using NEXRAD Ground-Based Radar Images
3. Validation and calibration of NEXRAD data using rain gauge observations. NEXRAD-VC can identify the concurrent paired precipitation
records where both rain gauge observations and NEXRAD data are available. Using these pairs of records, different statistical evaluation coefficients
are calculated to evaluate the accuracy of NEXRAD data and the crossvalidation performance of different NEXRAD data calibration methods.
4. Multiple output files. NEXRAD data calibrated by different methods are
output in raster format, which can be easily visualized using ArcGIS or
other GIS software. The spatial average precipitation is derived for each
hydrologic unit and output in text format for distributed hydrologic and
ecological modeling. In addition, rain gauge observations, NEXRAD estimates, and calibrated NEXRAD values using the specified cross-validation
method are output in one text file for each rain gauge. These output files
allow users to validate the accuracy of NEXRAD data and evaluate the
performance of different calibration methods.
12.3.2 nexRad caliBRation algoRithMS in nexRad-vc
A number of spatial prediction techniques are available. Ordinary kriging (OK) and
simple kriging (SK) (Isaaks and Srivastava 1989) are two widely used univariate
Rain gauge point
shapefile
Hydrologic unit
polygon shapefile
Each rain gauge’s rainfall
records in text format
Input each time step’s rainfall to
the corresponding rain gauge point
Input and transform the format
of NEXRAD data into ArcGIS
grid format
Match projection and identify the pairs
of rain gauge observations and
NEXRAD estimates
Extract precipitation for
each hydrologic unit
Validate NEXRAD using
rain gauge data
Calibrate NEXRAD using
rain gauge data
Spatial average
precipitation for each
hydrologic unit
Spatial precipitation map in the ArcGIS grid format
Evaluation coefficients (e.g., detecting capability,
estimation bias, correlation coefficient, estimation
efficiency, and ratio of variance)
NEXRAD data in
compressed binary or
NETCDF format
Input data
Data processing
functions
Output
FIGURE 12.1 Work flowchart of GIS-based NEXRAD evaluation and calibration program. (Adapted from Zhang, X. and Srinivasan, R., Environmental Modelling & Software,
25, 1781–1788, 2010.)