

259
Multispectral Satellite Data for Flood Monitoring and Inundation Mapping
et al. 2007). The data are available on the TRMM web site (http://trmm
.gsfc.nasa.gov) at 0.25° × 0.25° spatial and 3-h temporal scales within 50°
N–S latitude band.
3. Soil parameters are provided by the FAO (2003; http://www.fao.org/AG/agl/
agll/dsmw.html).
4. The MODIS land classification map used as a surrogate for land use/
cover, with 17 classes of land cover according to the classification in the
International Geosphere–Biosphere Programme (Friedl et al. 2002).
5. Global daily potential evapotranspiration data were obtained from the
Famine Early Warning Systems Network (http://earlywarning.usgs.gov/
Global/index.php).
11.4 RESULTS AND DISCUSSION
In this section, we presented the CREST model calibration and validation, followed
by the application of the two alternative methods for inundation mapping, namely,
CREST-simulated and satellite-based methods to generate the flood inundation
maps for three different flood events in the study area. The comparisons of CRESTsimulated flood extents with satellite-based observations provide an evaluation of
the CREST model performance in simulation of the spatiotemporal evolution of the
flood inundation extent.
11.4.1 hydRologic Model caliBRation
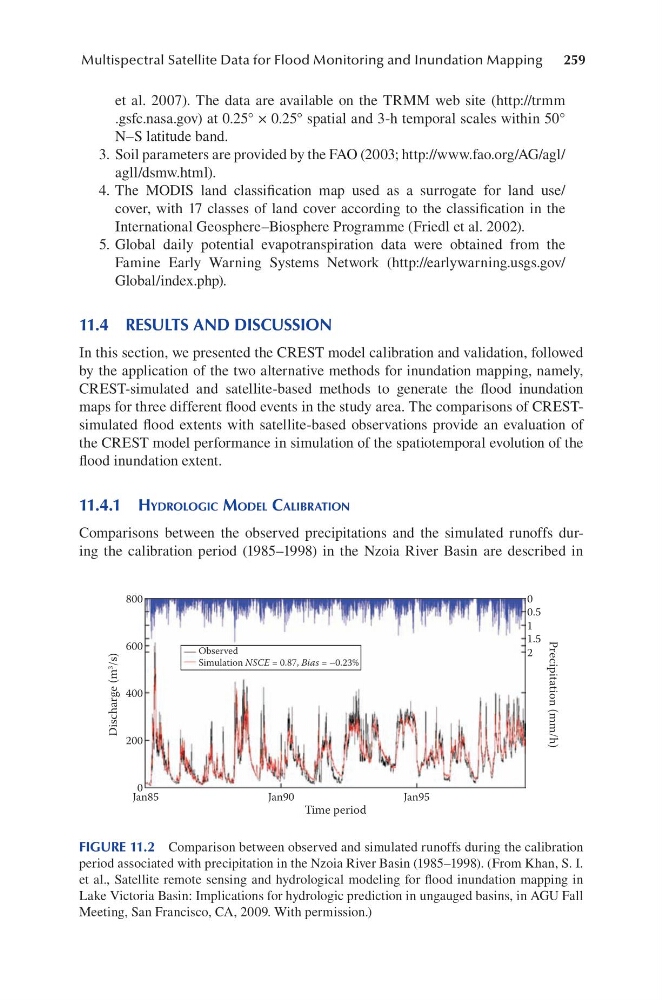
Comparisons between the observed precipitations and the simulated runoffs during the calibration period (1985–1998) in the Nzoia River Basin are described in
800
0
1
2
0.5
1.5
600
Observed
Simulation NSCE = 0.87, Bias = –0.23%
400
200
0
Jan85
Jan90
Jan95
Time period
Discharge (m
3
/s)
Precipitation (mm/h)
FIGURE 11.2 Comparison between observed and simulated runoffs during the calibration
period associated with precipitation in the Nzoia River Basin (1985–1998). (From Khan, S. I.
et al., Satellite remote sensing and hydrological modeling for flood inundation mapping in
Lake Victoria Basin: Implications for hydrologic prediction in ungauged basins, in AGU Fall
Meeting, San Francisco, CA, 2009. With permission.)
Multispectral Satellite Data for Flood Monitoring and Inundation Mapping
et al. 2007). The data are available on the TRMM web site (http://trmm
.gsfc.nasa.gov) at 0.25° × 0.25° spatial and 3-h temporal scales within 50°
N–S latitude band.
3. Soil parameters are provided by the FAO (2003; http://www.fao.org/AG/agl/
agll/dsmw.html).
4. The MODIS land classification map used as a surrogate for land use/
cover, with 17 classes of land cover according to the classification in the
International Geosphere–Biosphere Programme (Friedl et al. 2002).
5. Global daily potential evapotranspiration data were obtained from the
Famine Early Warning Systems Network (http://earlywarning.usgs.gov/
Global/index.php).
11.4 RESULTS AND DISCUSSION
In this section, we presented the CREST model calibration and validation, followed
by the application of the two alternative methods for inundation mapping, namely,
CREST-simulated and satellite-based methods to generate the flood inundation
maps for three different flood events in the study area. The comparisons of CRESTsimulated flood extents with satellite-based observations provide an evaluation of
the CREST model performance in simulation of the spatiotemporal evolution of the
flood inundation extent.
11.4.1 hydRologic Model caliBRation
Comparisons between the observed precipitations and the simulated runoffs during the calibration period (1985–1998) in the Nzoia River Basin are described in
800
0
1
2
0.5
1.5
600
Observed
Simulation NSCE = 0.87, Bias = –0.23%
400
200
0
Jan85
Jan90
Jan95
Time period
Discharge (m
3
/s)
Precipitation (mm/h)
FIGURE 11.2 Comparison between observed and simulated runoffs during the calibration
period associated with precipitation in the Nzoia River Basin (1985–1998). (From Khan, S. I.
et al., Satellite remote sensing and hydrological modeling for flood inundation mapping in
Lake Victoria Basin: Implications for hydrologic prediction in ungauged basins, in AGU Fall
Meeting, San Francisco, CA, 2009. With permission.)