

233
Modeling Snowmelt Runoff under Climate Change Scenarios
curvature of the S curve to approximate the rate of depletion of S derived from the
time sequence of the MODIS 8-day snow cover product. Gaussian cumulative distribution function values, F(z), can be obtained from tables or polynomial approximations such as (Chow et al. 1988)
B
z
z
z
z
=
+
+
+
+
1
2
1 0 196854
0 115194
0 000344
0 019527
2
3
.
.
.
.
4 4
4
−
(10.9)
where |z| is the absolute value of z, F(z) = B for z < 0, and F(z) = (1 – B) for z ≥ 0. As
noted above, S =1 – F(z), so this yields
S = 1 – B for z < 0
(10.10)
or
S = B for z ≥ 0.
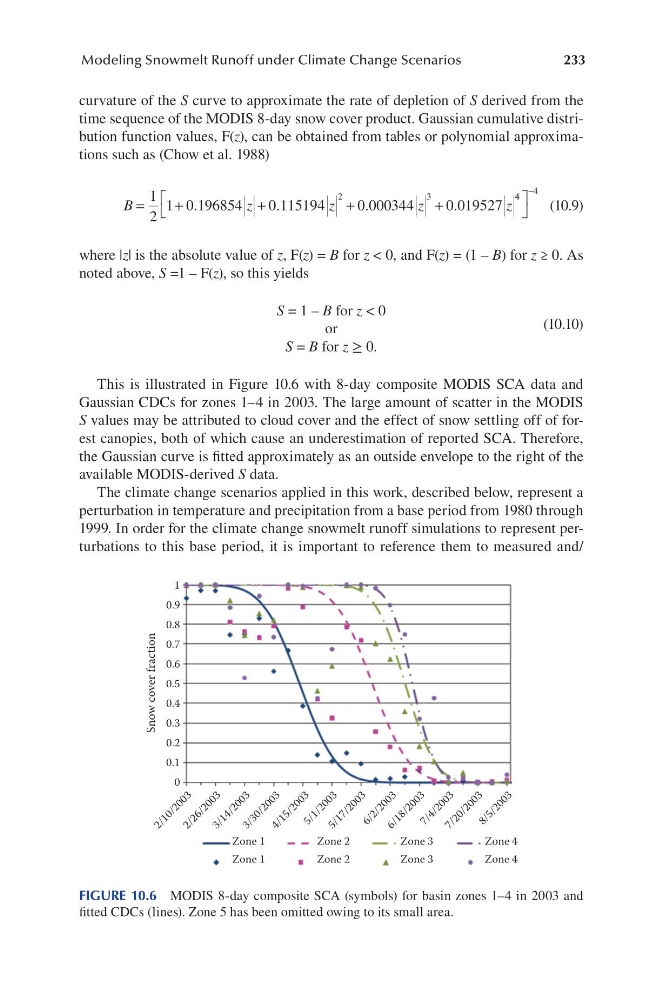
This is illustrated in Figure 10.6 with 8-day composite MODIS SCA data and
Gaussian CDCs for zones 1–4 in 2003. The large amount of scatter in the MODIS
S values may be attributed to cloud cover and the effect of snow settling off of forest canopies, both of which cause an underestimation of reported SCA. Therefore,
the Gaussian curve is fitted approximately as an outside envelope to the right of the
available MODIS-derived S data.
The climate change scenarios applied in this work, described below, represent a
perturbation in temperature and precipitation from a base period from 1980 through
1999. In order for the climate change snowmelt runoff simulations to represent perturbations to this base period, it is important to reference them to measured and/
1
0.9
0.8
0.7
0.6
0.5
0.4
0.3
0.2
Snow cover fraction
0.1
0
2 / 1 0 / 2 0 0 3
2 / 2 6 / 2 0 0 3
3 / 1 4 / 2 0 0 3
3 / 3 0 / 2 0 0 3
4 / 1 5 / 2 0 0 3
5 / 1 / 2 0 0 3
5 / 1 7 / 2 0 0 3
6 / 2 / 2 0 0 3
6 / 1 8 / 2 0 0 3
7 / 4 / 2 0 0 3
7 / 2 0 / 2 0 0 3
8 / 5 / 2 0 0 3
Zone 1
Zone 1
Zone 2
Zone 2
Zone 3
Zone 3
Zone 4
Zone 4
FIGURE 10.6 MODIS 8-day composite SCA (symbols) for basin zones 1–4 in 2003 and
fitted CDCs (lines). Zone 5 has been omitted owing to its small area.
Modeling Snowmelt Runoff under Climate Change Scenarios
curvature of the S curve to approximate the rate of depletion of S derived from the
time sequence of the MODIS 8-day snow cover product. Gaussian cumulative distribution function values, F(z), can be obtained from tables or polynomial approximations such as (Chow et al. 1988)
B
z
z
z
z
=
+
+
+
+
1
2
1 0 196854
0 115194
0 000344
0 019527
2
3
.
.
.
.
4 4
4
−
(10.9)
where |z| is the absolute value of z, F(z) = B for z < 0, and F(z) = (1 – B) for z ≥ 0. As
noted above, S =1 – F(z), so this yields
S = 1 – B for z < 0
(10.10)
or
S = B for z ≥ 0.
This is illustrated in Figure 10.6 with 8-day composite MODIS SCA data and
Gaussian CDCs for zones 1–4 in 2003. The large amount of scatter in the MODIS
S values may be attributed to cloud cover and the effect of snow settling off of forest canopies, both of which cause an underestimation of reported SCA. Therefore,
the Gaussian curve is fitted approximately as an outside envelope to the right of the
available MODIS-derived S data.
The climate change scenarios applied in this work, described below, represent a
perturbation in temperature and precipitation from a base period from 1980 through
1999. In order for the climate change snowmelt runoff simulations to represent perturbations to this base period, it is important to reference them to measured and/
1
0.9
0.8
0.7
0.6
0.5
0.4
0.3
0.2
Snow cover fraction
0.1
0
2 / 1 0 / 2 0 0 3
2 / 2 6 / 2 0 0 3
3 / 1 4 / 2 0 0 3
3 / 3 0 / 2 0 0 3
4 / 1 5 / 2 0 0 3
5 / 1 / 2 0 0 3
5 / 1 7 / 2 0 0 3
6 / 2 / 2 0 0 3
6 / 1 8 / 2 0 0 3
7 / 4 / 2 0 0 3
7 / 2 0 / 2 0 0 3
8 / 5 / 2 0 0 3
Zone 1
Zone 1
Zone 2
Zone 2
Zone 3
Zone 3
Zone 4
Zone 4
FIGURE 10.6 MODIS 8-day composite SCA (symbols) for basin zones 1–4 in 2003 and
fitted CDCs (lines). Zone 5 has been omitted owing to its small area.