

126
Multiscale Hydrologic Remote Sensing: Perspectives and Applications
X
X
X
X
X
X
V
( )
( ) .
( ) ( )
( )
( )
(
14
2 15 6 574
15 20
19
15 2
= −
+
=
0 0
18
20
19
6 574
16
21
8
) ( )
( )
( )
.
( )
( ) ( )
X
X
X
X
X
X
+
+
=
−
− −
+
=
6 574
19 8 285
0 20
17
0
.
( ) .
( ) ( )
( )
( ) (
X
V X
X
V X 2 20 22
4 974
20
1
20
18 6 574
) ( )
.
( )
( )
( )
( ) .
X
X
V
X
X
−
−
−
=
+ V
V
V
V
X
V
X
( ) ( ) ( )
( )
.
( )
.
(
0
0
1 2 19 15 57
1 17 224
1
+
+
−
+
{
}
9 9
21
0 20
0 2 1 6 895
17
20
)
( )
( ) ( )
( )
( ) .
( )
( )
=
+
+
+
X
V X
V
V
X
X
+
= −
+
=
8 63
20
0
21 1 166
21 2
.
( )
( ) ( ) .
( )
(
X
V
X
X
V 0 0 1 2 7724 0 22 37 282 12 1974
22
2
) ( ) .
( ) ( )
.
.
( )
(
V
V
X
X
V
+
+
−
= 1 1
2 5119
27 471
1
0 193
2
)
.
.
( )
.
,
+
−
V
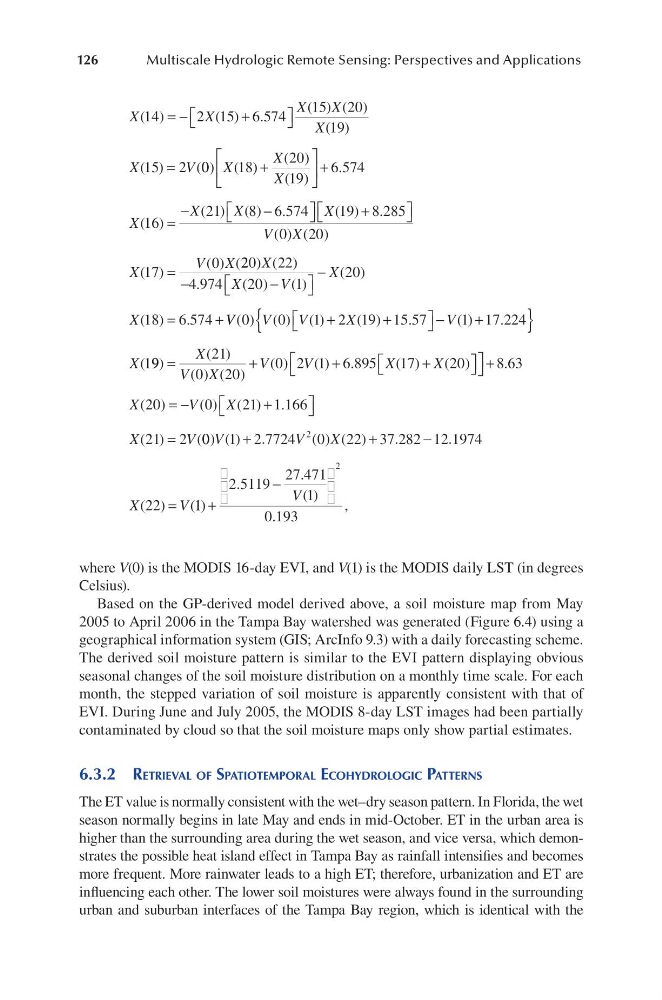
where V(0) is the MODIS 16-day EVI, and V(1) is the MODIS daily LST (in degrees
Celsius).
Based on the GP-derived model derived above, a soil moisture map from May
2005 to April 2006 in the Tampa Bay watershed was generated (Figure 6.4) using a
geographical information system (GIS; ArcInfo 9.3) with a daily forecasting scheme.
The derived soil moisture pattern is similar to the EVI pattern displaying obvious
seasonal changes of the soil moisture distribution on a monthly time scale. For each
month, the stepped variation of soil moisture is apparently consistent with that of
EVI. During June and July 2005, the MODIS 8-day LST images had been partially
contaminated by cloud so that the soil moisture maps only show partial estimates.
6.3.2 RetRieval of SPatioteMPoRal ecohydRologic PatteRnS
The ET value is normally consistent with the wet–dry season pattern. In Florida, the wet
season normally begins in late May and ends in mid-October. ET in the urban area is
higher than the surrounding area during the wet season, and vice versa, which demonstrates the possible heat island effect in Tampa Bay as rainfall intensifies and becomes
more frequent. More rainwater leads to a high ET; therefore, urbanization and ET are
influencing each other. The lower soil moistures were always found in the surrounding
urban and suburban interfaces of the Tampa Bay region, which is identical with the
Multiscale Hydrologic Remote Sensing: Perspectives and Applications
X
X
X
X
X
X
V
( )
( ) .
( ) ( )
( )
( )
(
14
2 15 6 574
15 20
19
15 2
= −
+
=
0 0
18
20
19
6 574
16
21
8
) ( )
( )
( )
.
( )
( ) ( )
X
X
X
X
X
X
+
+
=
−
− −
+
=
6 574
19 8 285
0 20
17
0
.
( ) .
( ) ( )
( )
( ) (
X
V X
X
V X 2 20 22
4 974
20
1
20
18 6 574
) ( )
.
( )
( )
( )
( ) .
X
X
V
X
X
−
−
−
=
+ V
V
V
V
X
V
X
( ) ( ) ( )
( )
.
( )
.
(
0
0
1 2 19 15 57
1 17 224
1
+
+
−
+
{
}
9 9
21
0 20
0 2 1 6 895
17
20
)
( )
( ) ( )
( )
( ) .
( )
( )
=
+
+
+
X
V X
V
V
X
X
+
= −
+
=
8 63
20
0
21 1 166
21 2
.
( )
( ) ( ) .
( )
(
X
V
X
X
V 0 0 1 2 7724 0 22 37 282 12 1974
22
2
) ( ) .
( ) ( )
.
.
( )
(
V
V
X
X
V
+
+
−
= 1 1
2 5119
27 471
1
0 193
2
)
.
.
( )
.
,
+
−
V
where V(0) is the MODIS 16-day EVI, and V(1) is the MODIS daily LST (in degrees
Celsius).
Based on the GP-derived model derived above, a soil moisture map from May
2005 to April 2006 in the Tampa Bay watershed was generated (Figure 6.4) using a
geographical information system (GIS; ArcInfo 9.3) with a daily forecasting scheme.
The derived soil moisture pattern is similar to the EVI pattern displaying obvious
seasonal changes of the soil moisture distribution on a monthly time scale. For each
month, the stepped variation of soil moisture is apparently consistent with that of
EVI. During June and July 2005, the MODIS 8-day LST images had been partially
contaminated by cloud so that the soil moisture maps only show partial estimates.
6.3.2 RetRieval of SPatioteMPoRal ecohydRologic PatteRnS
The ET value is normally consistent with the wet–dry season pattern. In Florida, the wet
season normally begins in late May and ends in mid-October. ET in the urban area is
higher than the surrounding area during the wet season, and vice versa, which demonstrates the possible heat island effect in Tampa Bay as rainfall intensifies and becomes
more frequent. More rainwater leads to a high ET; therefore, urbanization and ET are
influencing each other. The lower soil moistures were always found in the surrounding
urban and suburban interfaces of the Tampa Bay region, which is identical with the