

124
Multiscale Hydrologic Remote Sensing: Perspectives and Applications
GP model to retrieve the soil moisture value for a 1-year span. EVI maps from May
2005 to April 2006 in the Tampa Bay watershed (Figure 6.2) were used to visually
show the high percentage of vegetation cover (shown in green) and bare soil (shown
in red). Lower EVI values appear on the west part of the study area year round, especially in the area along Tampa Bay, the location of the major metropolitan area. The
pattern verifies that urbanization has a remarkable effect on the natural vegetation
cover. The rest of the Tampa Bay watershed (i.e., suburban area) exhibits a significant seasonal change of the vegetation cover over a year, evidenced by the overall
drop in EVI values below 0.45 in November and recovery along the Hillsborough
River beginning in April and continuing through summer. Expanded green areas can
be observed around the wet season. In addition, LST data in the same region were
used based on MODIS products (MOD11A1). When LST readings were disturbed by
cloud cover, an 8-day LST (MOD11A2) was used instead of a 1-day LST.
Model screening and selection were carried out based on the fitness value, causing many GP-derived models to be rejected due to either overfitting or poor fitness.
For overfitting, our findings indicate that less complex-structured models may have a
better chance to survive the final selection. Only the top 30 models with the highest
level of fitness were selected for further evaluation; however, the best model based
on the fitness of the training data may not perform as well as those cases based on
the unseen data. Therefore, the GP model that performed well on both the unseen
data set and the calibration data set was chosen for this study. Consequently, the
best GP-derived model of soil moisture was chosen based on R-squared calculated
from the corresponding unseen data set. The computational time required to create
a GP-derived model depends on the amount of input data, the number of variables,
and/or the complexity of embedded intrinsic features of nonlinearity.
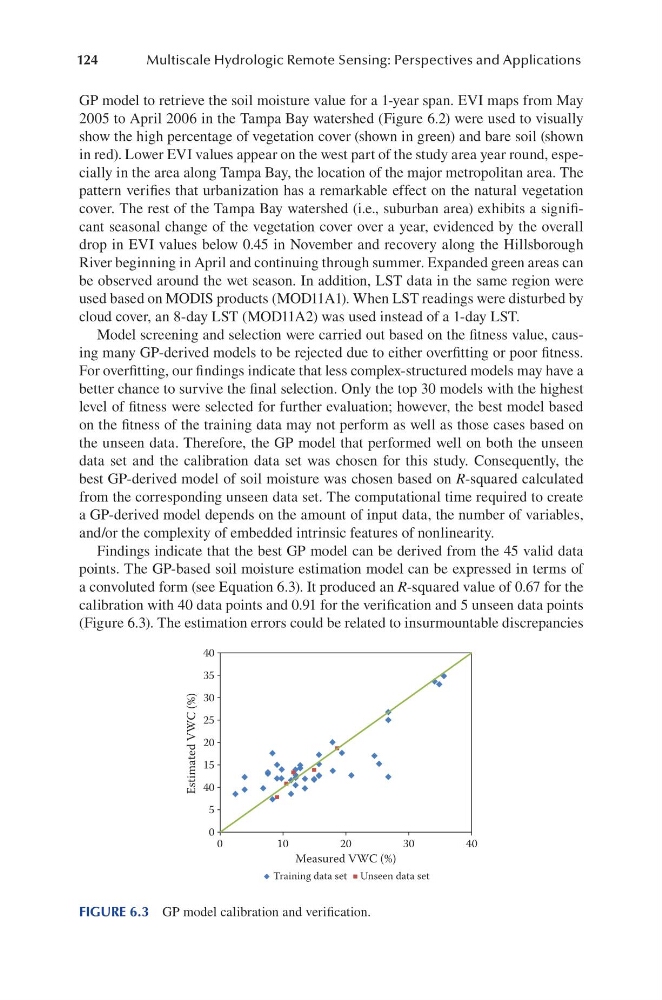
Findings indicate that the best GP model can be derived from the 45 valid data
points. The GP-based soil moisture estimation model can be expressed in terms of
a convoluted form (see Equation 6.3). It produced an R-squared value of 0.67 for the
calibration with 40 data points and 0.91 for the verification and 5 unseen data points
(Figure 6.3). The estimation errors could be related to insurmountable discrepancies
40
35
30
25
20
15
40
5
0
0
10
20
Measured VWC (%)
Estimated VWC (%)
Training data set Unseen data set
30
40
FIGURE 6.3 GP model calibration and verification.
Multiscale Hydrologic Remote Sensing: Perspectives and Applications
GP model to retrieve the soil moisture value for a 1-year span. EVI maps from May
2005 to April 2006 in the Tampa Bay watershed (Figure 6.2) were used to visually
show the high percentage of vegetation cover (shown in green) and bare soil (shown
in red). Lower EVI values appear on the west part of the study area year round, especially in the area along Tampa Bay, the location of the major metropolitan area. The
pattern verifies that urbanization has a remarkable effect on the natural vegetation
cover. The rest of the Tampa Bay watershed (i.e., suburban area) exhibits a significant seasonal change of the vegetation cover over a year, evidenced by the overall
drop in EVI values below 0.45 in November and recovery along the Hillsborough
River beginning in April and continuing through summer. Expanded green areas can
be observed around the wet season. In addition, LST data in the same region were
used based on MODIS products (MOD11A1). When LST readings were disturbed by
cloud cover, an 8-day LST (MOD11A2) was used instead of a 1-day LST.
Model screening and selection were carried out based on the fitness value, causing many GP-derived models to be rejected due to either overfitting or poor fitness.
For overfitting, our findings indicate that less complex-structured models may have a
better chance to survive the final selection. Only the top 30 models with the highest
level of fitness were selected for further evaluation; however, the best model based
on the fitness of the training data may not perform as well as those cases based on
the unseen data. Therefore, the GP model that performed well on both the unseen
data set and the calibration data set was chosen for this study. Consequently, the
best GP-derived model of soil moisture was chosen based on R-squared calculated
from the corresponding unseen data set. The computational time required to create
a GP-derived model depends on the amount of input data, the number of variables,
and/or the complexity of embedded intrinsic features of nonlinearity.
Findings indicate that the best GP model can be derived from the 45 valid data
points. The GP-based soil moisture estimation model can be expressed in terms of
a convoluted form (see Equation 6.3). It produced an R-squared value of 0.67 for the
calibration with 40 data points and 0.91 for the verification and 5 unseen data points
(Figure 6.3). The estimation errors could be related to insurmountable discrepancies
40
35
30
25
20
15
40
5
0
0
10
20
Measured VWC (%)
Estimated VWC (%)
Training data set Unseen data set
30
40
FIGURE 6.3 GP model calibration and verification.