

where currents tend to swing offshore, cold water
wells up from below.
In my system, there are four domains, and 14
divisions, plus the continental shelf area where
the shallow waters (<200 m), are interpreted as
shallow variations of the ecoregion involved.
Plate 1 (Maps, p. 165) shows the distribution of
the oceanic ecoregion domains and divisions.
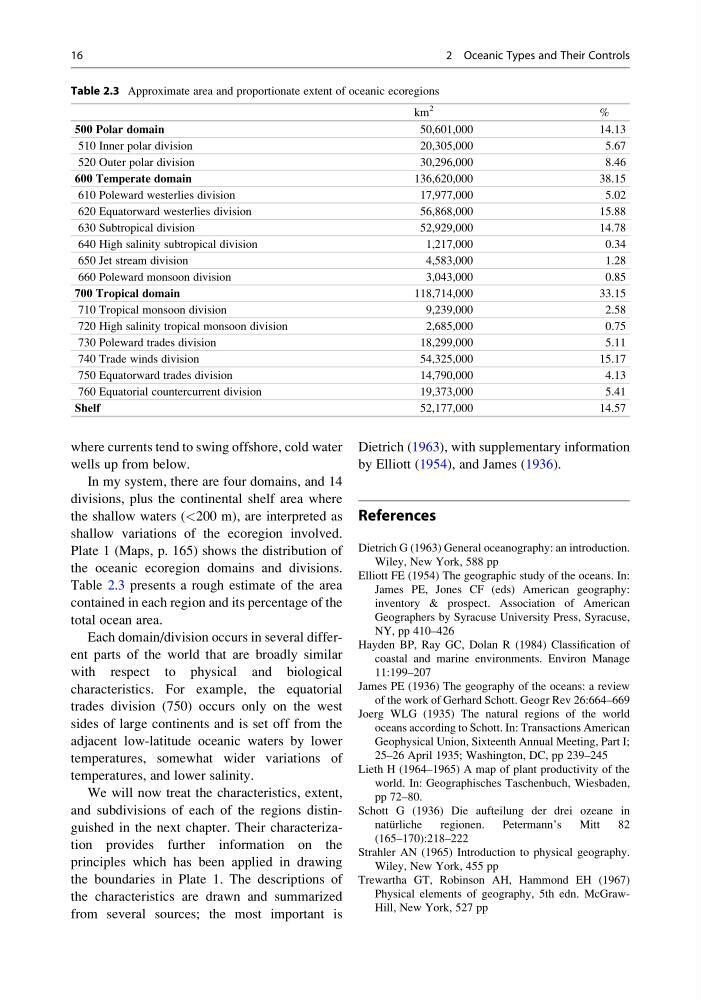
Table 2.3 presents a rough estimate of the area
contained in each region and its percentage of the
total ocean area.
Each domain/division occurs in several different parts of the world that are broadly similar
with respect to physical and biological
characteristics. For example, the equatorial
trades division (750) occurs only on the west
sides of large continents and is set off from the
adjacent low-latitude oceanic waters by lower
temperatures, somewhat wider variations of
temperatures, and lower salinity.
We will now treat the characteristics, extent,
and subdivisions of each of the regions distinguished in the next chapter. Their characterization provides further information on the
principles which has been applied in drawing
the boundaries in Plate 1. The descriptions of
the characteristics are drawn and summarized
from several sources; the most important is
Dietrich (1963), with supplementary information
by Elliott (1954), and James (1936).
References
Dietrich G (1963) General oceanography: an introduction.
Wiley, New York, 588 pp
Elliott FE (1954) The geographic study of the oceans. In:
James PE, Jones CF (eds) American geography:
inventory & prospect. Association of American
Geographers by Syracuse University Press, Syracuse,
NY, pp 410–426
Hayden BP, Ray GC, Dolan R (1984) Classification of
coastal and marine environments. Environ Manage
11:199–207
James PE (1936) The geography of the oceans: a review
of the work of Gerhard Schott. Geogr Rev 26:664–669
Joerg WLG (1935) The natural regions of the world
oceans according to Schott. In: Transactions American
Geophysical Union, Sixteenth Annual Meeting, Part I;
25–26 April 1935; Washington, DC, pp 239–245
Lieth H (1964–1965) A map of plant productivity of the
world. In: Geographisches Taschenbuch, Wiesbaden,
pp 72–80.
Schott G (1936) Die aufteilung der drei ozeane in
natu ¨rliche
regionen.
Petermann’s
Mitt
82
(165–170):218–222
Strahler AN (1965) Introduction to physical geography.
Wiley, New York, 455 pp
Trewartha GT, Robinson AH, Hammond EH (1967)
Physical elements of geography, 5th edn. McGrawHill, New York, 527 pp
Table 2.3 Approximate area and proportionate extent of oceanic ecoregions
km
2
%
500 Polar domain
50,601,000
14.13
510 Inner polar division
20,305,000
5.67
520 Outer polar division
30,296,000
8.46
600 Temperate domain
136,620,000
38.15
610 Poleward westerlies division
17,977,000
5.02
620 Equatorward westerlies division
56,868,000
15.88
630 Subtropical division
52,929,000
14.78
640 High salinity subtropical division
1,217,000
0.34
650 Jet stream division
4,583,000
1.28
660 Poleward monsoon division
3,043,000
0.85
700 Tropical domain
118,714,000
33.15
710 Tropical monsoon division
9,239,000
2.58
720 High salinity tropical monsoon division
2,685,000
0.75
730 Poleward trades division
18,299,000
5.11
740 Trade winds division
54,325,000
15.17
750 Equatorward trades division
14,790,000
4.13
760 Equatorial countercurrent division
19,373,000
5.41
Shelf
52,177,000
14.57
16
2 Oceanic Types and Their Controls
wells up from below.
In my system, there are four domains, and 14
divisions, plus the continental shelf area where
the shallow waters (<200 m), are interpreted as
shallow variations of the ecoregion involved.
Plate 1 (Maps, p. 165) shows the distribution of
the oceanic ecoregion domains and divisions.
Table 2.3 presents a rough estimate of the area
contained in each region and its percentage of the
total ocean area.
Each domain/division occurs in several different parts of the world that are broadly similar
with respect to physical and biological
characteristics. For example, the equatorial
trades division (750) occurs only on the west
sides of large continents and is set off from the
adjacent low-latitude oceanic waters by lower
temperatures, somewhat wider variations of
temperatures, and lower salinity.
We will now treat the characteristics, extent,
and subdivisions of each of the regions distinguished in the next chapter. Their characterization provides further information on the
principles which has been applied in drawing
the boundaries in Plate 1. The descriptions of
the characteristics are drawn and summarized
from several sources; the most important is
Dietrich (1963), with supplementary information
by Elliott (1954), and James (1936).
References
Dietrich G (1963) General oceanography: an introduction.
Wiley, New York, 588 pp
Elliott FE (1954) The geographic study of the oceans. In:
James PE, Jones CF (eds) American geography:
inventory & prospect. Association of American
Geographers by Syracuse University Press, Syracuse,
NY, pp 410–426
Hayden BP, Ray GC, Dolan R (1984) Classification of
coastal and marine environments. Environ Manage
11:199–207
James PE (1936) The geography of the oceans: a review
of the work of Gerhard Schott. Geogr Rev 26:664–669
Joerg WLG (1935) The natural regions of the world
oceans according to Schott. In: Transactions American
Geophysical Union, Sixteenth Annual Meeting, Part I;
25–26 April 1935; Washington, DC, pp 239–245
Lieth H (1964–1965) A map of plant productivity of the
world. In: Geographisches Taschenbuch, Wiesbaden,
pp 72–80.
Schott G (1936) Die aufteilung der drei ozeane in
natu ¨rliche
regionen.
Petermann’s
Mitt
82
(165–170):218–222
Strahler AN (1965) Introduction to physical geography.
Wiley, New York, 455 pp
Trewartha GT, Robinson AH, Hammond EH (1967)
Physical elements of geography, 5th edn. McGrawHill, New York, 527 pp
Table 2.3 Approximate area and proportionate extent of oceanic ecoregions
km
2
%
500 Polar domain
50,601,000
14.13
510 Inner polar division
20,305,000
5.67
520 Outer polar division
30,296,000
8.46
600 Temperate domain
136,620,000
38.15
610 Poleward westerlies division
17,977,000
5.02
620 Equatorward westerlies division
56,868,000
15.88
630 Subtropical division
52,929,000
14.78
640 High salinity subtropical division
1,217,000
0.34
650 Jet stream division
4,583,000
1.28
660 Poleward monsoon division
3,043,000
0.85
700 Tropical domain
118,714,000
33.15
710 Tropical monsoon division
9,239,000
2.58
720 High salinity tropical monsoon division
2,685,000
0.75
730 Poleward trades division
18,299,000
5.11
740 Trade winds division
54,325,000
15.17
750 Equatorward trades division
14,790,000
4.13
760 Equatorial countercurrent division
19,373,000
5.41
Shelf
52,177,000
14.57
16
2 Oceanic Types and Their Controls