

246 Paleoceanography - the Deep-Sea Record
9.2.4 Pulsed Deglaciation. How and why did the last glacial change into the present
interglacial? How long did this take? The first question, presumably, must be
answered by invoking changes in the seasonal distribution of the Sun 's radiation (the
Milankovitch Mechanism, to be discussed in Sect. 9.3.5). The second question is the
more readily answered: it took between 7000 and 8000 years, approximately, to
reduce the ice masses of the last glacial to something like those we have today. In the
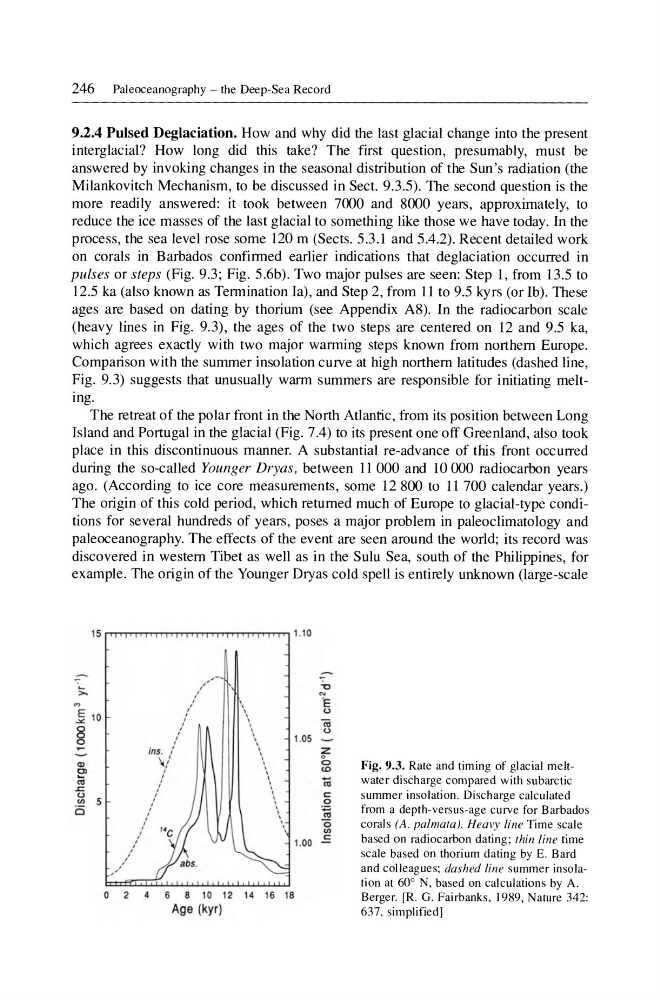
process, the sea level rose some 120 m (Sects. 5.3.1 and 5.4.2). Recent detailed work
on corals in Barbados confirmed earlier indications that deglaciation occurred in
pulses or steps (Fig. 9.3; Fig. 5.6b). Two major pulses are seen: Step 1, from 13.5 to
12.5 ka (also known as Termination Ia), and Step 2, from 11 to 9.5 kyrs (or Ib). These
ages are based on dating by thorium (see Appendix A8). In the radiocarbon scale
(heavy lines in Fig. 9.3), the ages of the two steps are centered on 12 and 9.5 ka,
which agrees exactly with two major warming steps known from northern Europe.
Comparison with the summer insolation curve at high northern latitudes (dashed line,
Fig. 9.3) suggests that unusually warm summers are responsible for initiating melting.
The retreat of the polar front in the North Atlantic, from its position between Long
Island and Portugal in the glacial (Fig. 7.4) to its present one off Greenland, also took
place in this discontinuous manner. A substantial re-advance of this front occurred
during the so-called Younger Dryas, between II 000 and 10 000 radiocarbon years
ago. (According to ice core measurements, some 12 SOO to 11 700 calendar years.)
The origin of this cold period, which returned much of Europe to glacial-type conditions for several hundreds of years, poses a major problem in paleoclimatology and
paleoceanography. The effects of the event are seen around the world; its record was
discovered in western Tibet as well as in the Sulu Sea, south of the Philippines, for
example. The origin of the Younger Dryas cold spell is entirely unknown (large-scale
15 1"TT"rTT"11"TT1""""""""'-rTTTTTTTTTTT"TTT"rrr1rT"1 1. 1 0
,,
,
>.
/
,
..,
, ,
E
,
\\
10
,
.><:
,
,
§
,
,
1. 05
,
\\
ins. /
Q)
/l
Ol
;u
\.
~
(.)
'"
5
0
,
1.00
,
,
,
,
,
0
2
6
8 10 12 14 16 18
Age (kyr)
"0
~E
<.J
~
0
c::
.!:?
(;j
"0
'"
-=
Fig. 9.3. Rate and timing of glacial meltwater discharge compared with subarctic
summer insolation. Discharge calculated
from a depth-versus-age curve for Barbados
corals (A . pa/mata). Heal'y line Time scale
based on radiocarbon dating; thin line time
scale based on thorium dating by E. Bard
and colleagues; dashed line summer insolation at 60° N, based on calculations by A.
Berge r. [R. G. Fairbanks, 1989, Nature 342:
637. simplified]
9.2.4 Pulsed Deglaciation. How and why did the last glacial change into the present
interglacial? How long did this take? The first question, presumably, must be
answered by invoking changes in the seasonal distribution of the Sun 's radiation (the
Milankovitch Mechanism, to be discussed in Sect. 9.3.5). The second question is the
more readily answered: it took between 7000 and 8000 years, approximately, to
reduce the ice masses of the last glacial to something like those we have today. In the
process, the sea level rose some 120 m (Sects. 5.3.1 and 5.4.2). Recent detailed work
on corals in Barbados confirmed earlier indications that deglaciation occurred in
pulses or steps (Fig. 9.3; Fig. 5.6b). Two major pulses are seen: Step 1, from 13.5 to
12.5 ka (also known as Termination Ia), and Step 2, from 11 to 9.5 kyrs (or Ib). These
ages are based on dating by thorium (see Appendix A8). In the radiocarbon scale
(heavy lines in Fig. 9.3), the ages of the two steps are centered on 12 and 9.5 ka,
which agrees exactly with two major warming steps known from northern Europe.
Comparison with the summer insolation curve at high northern latitudes (dashed line,
Fig. 9.3) suggests that unusually warm summers are responsible for initiating melting.
The retreat of the polar front in the North Atlantic, from its position between Long
Island and Portugal in the glacial (Fig. 7.4) to its present one off Greenland, also took
place in this discontinuous manner. A substantial re-advance of this front occurred
during the so-called Younger Dryas, between II 000 and 10 000 radiocarbon years
ago. (According to ice core measurements, some 12 SOO to 11 700 calendar years.)
The origin of this cold period, which returned much of Europe to glacial-type conditions for several hundreds of years, poses a major problem in paleoclimatology and
paleoceanography. The effects of the event are seen around the world; its record was
discovered in western Tibet as well as in the Sulu Sea, south of the Philippines, for
example. The origin of the Younger Dryas cold spell is entirely unknown (large-scale
15 1"TT"rTT"11"TT1""""""""'-rTTTTTTTTTTT"TTT"rrr1rT"1 1. 1 0
,,
,
>.
/
,
..,
, ,
E
,
\\
10
,
.><:
,
,
§
,
,
1. 05
,
\\
ins. /
Q)
/l
Ol
;u
\.
~
(.)
'"
5
0
,
1.00
,
,
,
,
,
0
2
6
8 10 12 14 16 18
Age (kyr)
"0
~E
<.J
~
0
c::
.!:?
(;j
"0
'"
-=
Fig. 9.3. Rate and timing of glacial meltwater discharge compared with subarctic
summer insolation. Discharge calculated
from a depth-versus-age curve for Barbados
corals (A . pa/mata). Heal'y line Time scale
based on radiocarbon dating; thin line time
scale based on thorium dating by E. Bard
and colleagues; dashed line summer insolation at 60° N, based on calculations by A.
Berge r. [R. G. Fairbanks, 1989, Nature 342:
637. simplified]