

Biogeographic Climate Indicators
189
1
CJ 2
ijg14
5
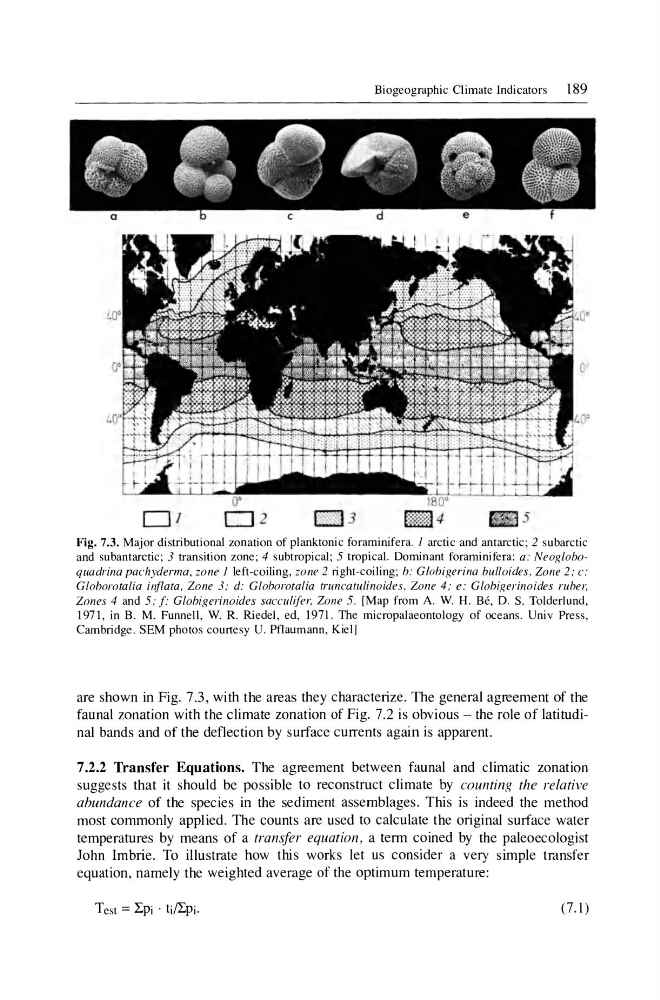
Fig. 7.3. Major distributional zonation of planktonic foraminifera. J arctic and antarctic; 2 subarctic
and subantarctic ; 3 transition zone; 4 subtropical; 5 tropical. Dominant foraminifera : a: Neogloboquadrina pachyderma, zone J left-coiling, zone 2 right-coiling; b: Globigerina bul/oides, Zone 2 ; c:
Globorotalia inflata , Zone 3; d: Globorotalia truncatulinoides , Zone 4 ; e: Globigerinoides ruber.
Zones 4 and 5; f: Globigerinoides sacculi/er, Zone 5. [Map from A. W. H. Be, D. S. Tolderlund,
1971, in B. M. Funnell, W. R. Riedel , ed, 1971. The micropalaeontology of oceans. Univ Press,
Cambridge. SEM photos courtesy U. Pflaumann , Kiell
are shown in Fig. 7.3, with the areas they characterize. The general agreement of the
faunal zonation with the climate zonation of Fig. 7.2 is obvious - the role of latitudinal bands and of the deflection by surface currents again is apparent.
7.2.2 Transfer Equations. The agreement between faunal and climatic zonation
suggests that it should be possible to reconstruct climate by counting the relative
abundance of the species in the sediment assemblages. This is indeed the method
most commonly applied. The counts are used to calculate the original surface water
temperatures by means of a transfer equation, a term coined by the paleoecologist
John Imbrie. To illustrate how this works let us consider a very simple transfer
equation, namely the weighted average of the optimum temperature:
(7.1 )
189
1
CJ 2
ijg14
5
Fig. 7.3. Major distributional zonation of planktonic foraminifera. J arctic and antarctic; 2 subarctic
and subantarctic ; 3 transition zone; 4 subtropical; 5 tropical. Dominant foraminifera : a: Neogloboquadrina pachyderma, zone J left-coiling, zone 2 right-coiling; b: Globigerina bul/oides, Zone 2 ; c:
Globorotalia inflata , Zone 3; d: Globorotalia truncatulinoides , Zone 4 ; e: Globigerinoides ruber.
Zones 4 and 5; f: Globigerinoides sacculi/er, Zone 5. [Map from A. W. H. Be, D. S. Tolderlund,
1971, in B. M. Funnell, W. R. Riedel , ed, 1971. The micropalaeontology of oceans. Univ Press,
Cambridge. SEM photos courtesy U. Pflaumann , Kiell
are shown in Fig. 7.3, with the areas they characterize. The general agreement of the
faunal zonation with the climate zonation of Fig. 7.2 is obvious - the role of latitudinal bands and of the deflection by surface currents again is apparent.
7.2.2 Transfer Equations. The agreement between faunal and climatic zonation
suggests that it should be possible to reconstruct climate by counting the relative
abundance of the species in the sediment assemblages. This is indeed the method
most commonly applied. The counts are used to calculate the original surface water
temperatures by means of a transfer equation, a term coined by the paleoecologist
John Imbrie. To illustrate how this works let us consider a very simple transfer
equation, namely the weighted average of the optimum temperature:
(7.1 )