

a
b
104
Effects of Waves and Currents
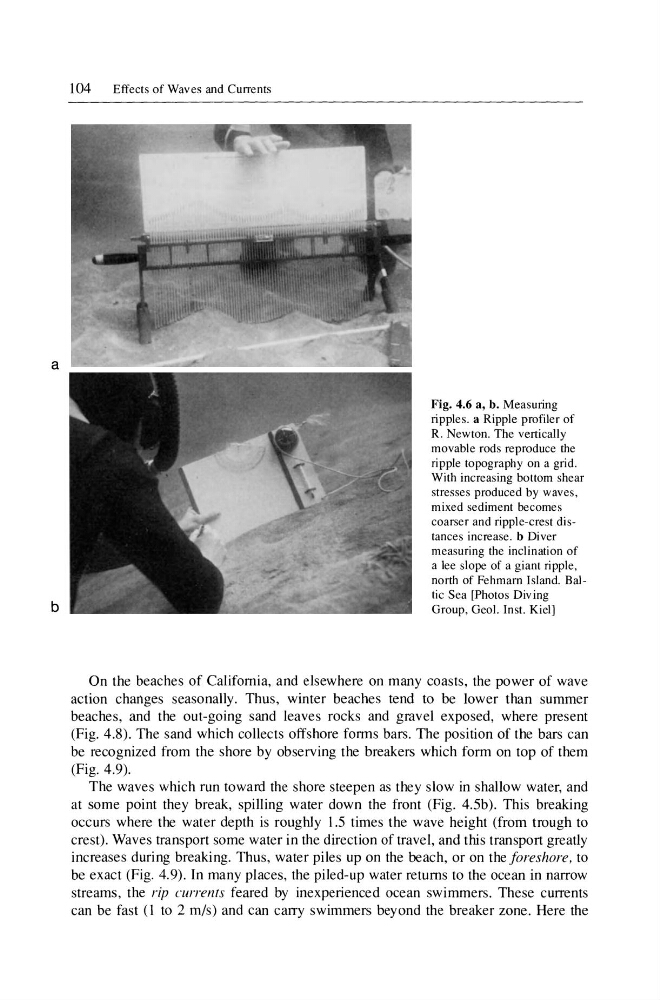
Fig. 4.6 a, b. Measuring
ripples. a Ripple profiler of
R. Newton. The vertically
movable rods reproduce the
ripple topography on a grid.
With increasing bottom shear
stresses produced by waves,
mixed sediment becomes
coarser and ripple-crest distances increase. b Diver
measuring the inclination of
a lee slope of a giant ripple,
north of Fehmarn Island. Baltic Sea [Photos Diving
Group, Geol. Inst. KielJ
On the beaches of California, and elsewhere on many coasts, the power of wave
action changes seasonally. Thus, winter beaches tend to be lower than summer
beaches, and the out-going sand leaves rocks and gravel exposed, where present
(Fig. 4.8). The sand which collects offshore fonns bars. The position of the bars can
be recognized from the shore by observing the breakers which form on top of them
(Fig. 4.9).
The waves which run toward the shore steepen as they slow in shallow water, and
at some point they break, spilling water down the front (Fig. 4.5b). This breaking
occurs where the water depth is roughly 1.5 times the wave height (from trough to
crest). Waves transport some water in the direction of travel, and this transport greatly
increases during breaking. Thus, water piles up on the beach, or on the foreshore, to
be exact (Fig. 4.9). In many places, the piled-up water returns to the ocean in narrow
streams, the rip currents feared by inexperienced ocean swimmers. These currents
can be fast (I to 2 m/s) and can carry swimmers beyond the breaker zone. Here the
b
104
Effects of Waves and Currents
Fig. 4.6 a, b. Measuring
ripples. a Ripple profiler of
R. Newton. The vertically
movable rods reproduce the
ripple topography on a grid.
With increasing bottom shear
stresses produced by waves,
mixed sediment becomes
coarser and ripple-crest distances increase. b Diver
measuring the inclination of
a lee slope of a giant ripple,
north of Fehmarn Island. Baltic Sea [Photos Diving
Group, Geol. Inst. KielJ
On the beaches of California, and elsewhere on many coasts, the power of wave
action changes seasonally. Thus, winter beaches tend to be lower than summer
beaches, and the out-going sand leaves rocks and gravel exposed, where present
(Fig. 4.8). The sand which collects offshore fonns bars. The position of the bars can
be recognized from the shore by observing the breakers which form on top of them
(Fig. 4.9).
The waves which run toward the shore steepen as they slow in shallow water, and
at some point they break, spilling water down the front (Fig. 4.5b). This breaking
occurs where the water depth is roughly 1.5 times the wave height (from trough to
crest). Waves transport some water in the direction of travel, and this transport greatly
increases during breaking. Thus, water piles up on the beach, or on the foreshore, to
be exact (Fig. 4.9). In many places, the piled-up water returns to the ocean in narrow
streams, the rip currents feared by inexperienced ocean swimmers. These currents
can be fast (I to 2 m/s) and can carry swimmers beyond the breaker zone. Here the