

4 Isotope Geochemistry in the Environment
75
This addition of salts puts an extreme burden on the Rhine and has the
consequence that both isotopic compositions and salt concentrations barely
decrease on their way to the mouth of the Rhine. Additional input of salts can be
observed at the neck of the Rhine in the industrial region of MannheimLudwigshafen. The influence of pit rinse water from the potassium mines on the
chemistry of the Rhine was discussed by Tricca and Stille (1996) and Tricca
(1997).
Fig. 4.23 illustrates the relationship between Sr concentration and Sr isotopic
composition in Rhine water and pit water. The 87Sr/S6Sr ratios of the waste water
from the potassium mines are around 0.7095, while the concentration is 31,4 m ~ .
The isotopic composition and concentration of Sr in the non-contaminated Rhine
water are 0.7084 and 0.38 mg/kg, respectively. Rhine water below the
introduction of this contaminated water shows a significantly higher Sr isotopic
composition of 0.7086-0.7087 and concentrations of 0.46-0.52 mg/kg
(Fessenheim). All sample points lie on a mixing line. The samples from
Fessenheim are the results of mixing uncontaminated Rhine water and rinse water
from the pits. Using these data and the equation system for the mixing of two
components (Faure 1986; page 141), one can calculate that about 6 m 3 of pit water
per second flows into the Rhine. As the main and trace element concentrations in
the contaminating tributary are known at this point, then the rate of flow for the
contaminating elements can be calculated Tricca 1997; Tricca and Stille 1996).
E
Clt.
EL
,:7
U
O.
8000
4000
0
0
1000
Kembs
Mainz
Ernmerich
.
.
.
.
.
.
.
.
.
9
i
5OO
LengTh of river (km)
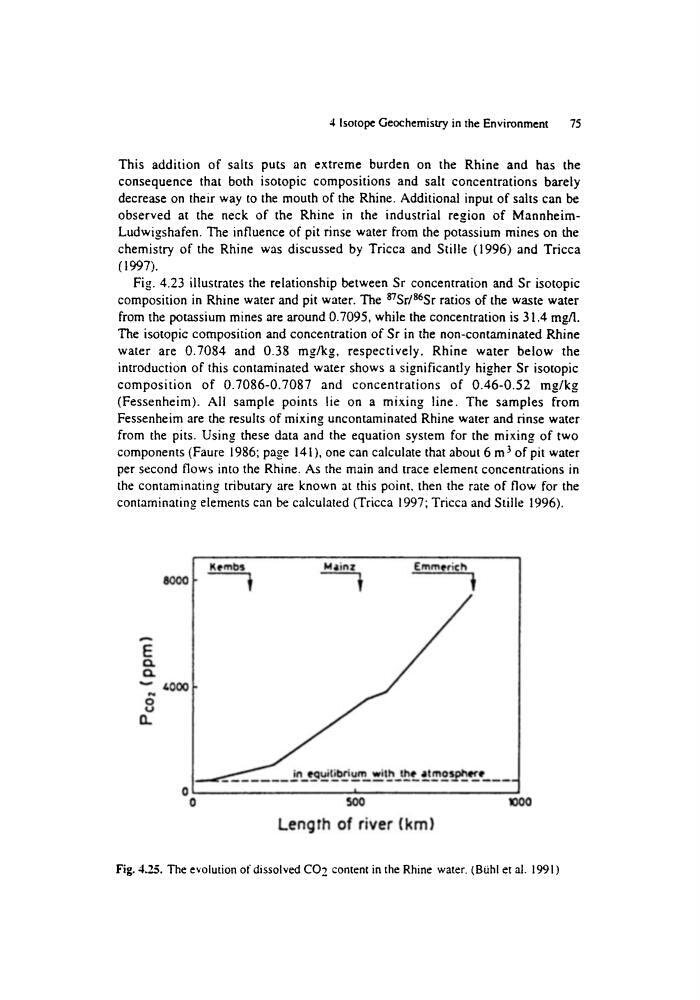
Fig. 4.25. The evolution of dissolved CO 2 content in the Rhine water. (Btihl et al. 1991)
75
This addition of salts puts an extreme burden on the Rhine and has the
consequence that both isotopic compositions and salt concentrations barely
decrease on their way to the mouth of the Rhine. Additional input of salts can be
observed at the neck of the Rhine in the industrial region of MannheimLudwigshafen. The influence of pit rinse water from the potassium mines on the
chemistry of the Rhine was discussed by Tricca and Stille (1996) and Tricca
(1997).
Fig. 4.23 illustrates the relationship between Sr concentration and Sr isotopic
composition in Rhine water and pit water. The 87Sr/S6Sr ratios of the waste water
from the potassium mines are around 0.7095, while the concentration is 31,4 m ~ .
The isotopic composition and concentration of Sr in the non-contaminated Rhine
water are 0.7084 and 0.38 mg/kg, respectively. Rhine water below the
introduction of this contaminated water shows a significantly higher Sr isotopic
composition of 0.7086-0.7087 and concentrations of 0.46-0.52 mg/kg
(Fessenheim). All sample points lie on a mixing line. The samples from
Fessenheim are the results of mixing uncontaminated Rhine water and rinse water
from the pits. Using these data and the equation system for the mixing of two
components (Faure 1986; page 141), one can calculate that about 6 m 3 of pit water
per second flows into the Rhine. As the main and trace element concentrations in
the contaminating tributary are known at this point, then the rate of flow for the
contaminating elements can be calculated Tricca 1997; Tricca and Stille 1996).
E
Clt.
EL
,:7
U
O.
8000
4000
0
0
1000
Kembs
Mainz
Ernmerich
.
.
.
.
.
.
.
.
.
9
i
5OO
LengTh of river (km)
Fig. 4.25. The evolution of dissolved CO 2 content in the Rhine water. (Btihl et al. 1991)