

62
Peter Stille and Graham Shields
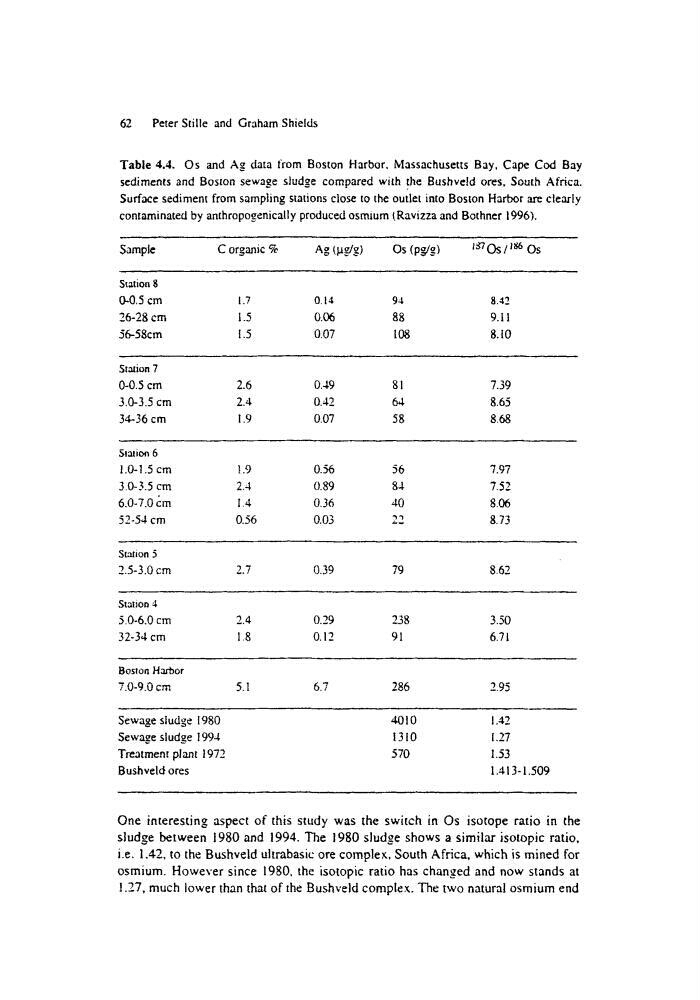
Table 4,4. Os and Ag data from Boston Harbor. Massachusetts Bay, Cape Cod Bay
sediments and Boston sewage sludge compared with the Bushveld o r e s , South Africa.
Surface sediment from sampling stations close to the outlet into Boston Harbor are clearly
contaminated by anthropogenically produced osmium I.Ravizza and Bothner 1996).
Sample
C organic %
Ag (la~g)
Os (p~g)
J~Os/le'60s
Station $
0-0.5 cm
1.7
0.14
94
8.42
26-28 cm
1.5
0.06
88
9.11
56-58cm
1.5
0.07
108
8. I0
Station 7
0-0.5 cm
2.6
0.49
81
7.39
3.0-3.5 cm
2.4
0.'42
6,1.
8.65
34--36 cm
1.9
0.07
58
8.68
Station 6
1.0- 1.5 cm
1.9
0.56
56
7.97
3.0-3.5 cm
2.4
0.89
84
7.52
6.0-7.0 cm
1.4
0.36
"40
8.06
52-54 cm
0.56
0.03
22
8. 73
Station 5
2.5-3.0 c m
2.7
0.39
79
8.62
Slation
50-6.0 cm
2.40.29
238
3.50
32-34 cm
1.8
0.12
91
6.71
Boslort Harbor
7.0-9.0 cm
5. I
6.7
286
2.95
Sewage sludge 1980
4010
1.42
Sewage sludge 1994
1310
1.27
Treatment plant 1972
570
1.53
Bushveld ores
1.413-1.509
One interesting aspect of this study was the switch in Os isotope ratio in the
sludge between 1980 and 1994. The 1980 sludge shows a similar isotopic ratio,
i.e. 1.42, to the Bushveld uhrabasic ore complex, South Africa, which is mined for
osmium. However since 1980, the isotopic ratio has changed and now stands at
1.27, much lower than that of the Bushveld complex. The two natural osmium end
Peter Stille and Graham Shields
Table 4,4. Os and Ag data from Boston Harbor. Massachusetts Bay, Cape Cod Bay
sediments and Boston sewage sludge compared with the Bushveld o r e s , South Africa.
Surface sediment from sampling stations close to the outlet into Boston Harbor are clearly
contaminated by anthropogenically produced osmium I.Ravizza and Bothner 1996).
Sample
C organic %
Ag (la~g)
Os (p~g)
J~Os/le'60s
Station $
0-0.5 cm
1.7
0.14
94
8.42
26-28 cm
1.5
0.06
88
9.11
56-58cm
1.5
0.07
108
8. I0
Station 7
0-0.5 cm
2.6
0.49
81
7.39
3.0-3.5 cm
2.4
0.'42
6,1.
8.65
34--36 cm
1.9
0.07
58
8.68
Station 6
1.0- 1.5 cm
1.9
0.56
56
7.97
3.0-3.5 cm
2.4
0.89
84
7.52
6.0-7.0 cm
1.4
0.36
"40
8.06
52-54 cm
0.56
0.03
22
8. 73
Station 5
2.5-3.0 c m
2.7
0.39
79
8.62
Slation
50-6.0 cm
2.40.29
238
3.50
32-34 cm
1.8
0.12
91
6.71
Boslort Harbor
7.0-9.0 cm
5. I
6.7
286
2.95
Sewage sludge 1980
4010
1.42
Sewage sludge 1994
1310
1.27
Treatment plant 1972
570
1.53
Bushveld ores
1.413-1.509
One interesting aspect of this study was the switch in Os isotope ratio in the
sludge between 1980 and 1994. The 1980 sludge shows a similar isotopic ratio,
i.e. 1.42, to the Bushveld uhrabasic ore complex, South Africa, which is mined for
osmium. However since 1980, the isotopic ratio has changed and now stands at
1.27, much lower than that of the Bushveld complex. The two natural osmium end