

134 Peter Stille and Graham Shields
3".5
0
10o0
r n
a 2oOO
3000
13..
40OO
5000
160
Salinity (%.)
35.0
35.5
36.0
36.5
/
;
I
5
lOz
I
f
t
I
I
I
I
1
!
A-lZ 109-1 5TN 95 |
|
I
I
190
220
37.0
Oz (pm / kg )
250
280
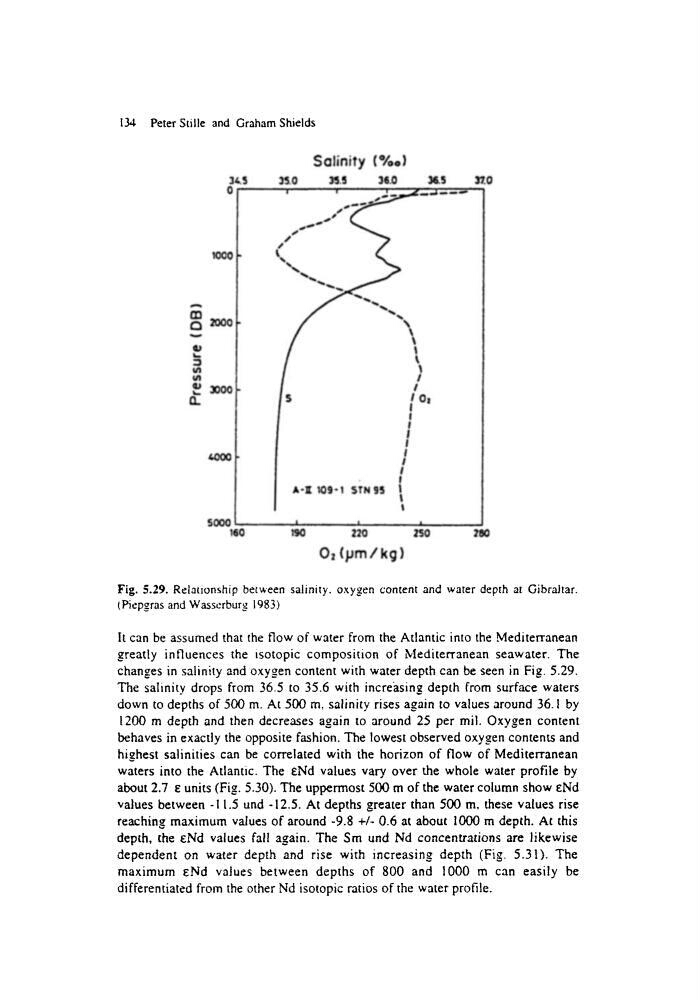
Fig. 5.29. Relationship between salinity, oxygen content and water depth at Gibraltar,
(Piepgras and Wasserburg 1983)
It can be assumed that the flow of water from the Atlantic into the Mediterranean
greatly influences the isotopic composition of Mediterranean seawater, The
changes in salinity and oxygen content with water depth can be seen in Fig. 5.29.
The salinity drops from 36.5 to 35.6 with increasing depth from surface waters
down to depths of 500 m. At 500 m, salinity rises again to values around 36. I by
1200 m depth and then decreases again to around 25 per mil. Oxygen content
behaves in exactly the opposite fashion. The lowest observed oxygen contents and
highest salinities can be correlated with the horizon of flow of Mediterranean
waters into the Atlantic. The end values vary over the whole water profile by
about 2.7 e units (Fig. 5.30). The uppermost 500 m of the water column show end
values between -11.5 und -12.5. At depths greater than 500 m, these values rise
reaching maximum values of around -9.8 +/- 0.6 at about 1000 m depth. At this
depth, the eNd values fall again. The Sm und Nd concentrations are likewise
dependent on water depth and rise with increasing depth (Fig. 5.31). The
maximum eNd values between depths of 800 and 1000 m can easily be
differentiated from the other Nd isotopic ratios of the water profile.
3".5
0
10o0
r n
a 2oOO
3000
13..
40OO
5000
160
Salinity (%.)
35.0
35.5
36.0
36.5
/
;
I
5
lOz
I
f
t
I
I
I
I
1
!
A-lZ 109-1 5TN 95 |
|
I
I
190
220
37.0
Oz (pm / kg )
250
280
Fig. 5.29. Relationship between salinity, oxygen content and water depth at Gibraltar,
(Piepgras and Wasserburg 1983)
It can be assumed that the flow of water from the Atlantic into the Mediterranean
greatly influences the isotopic composition of Mediterranean seawater, The
changes in salinity and oxygen content with water depth can be seen in Fig. 5.29.
The salinity drops from 36.5 to 35.6 with increasing depth from surface waters
down to depths of 500 m. At 500 m, salinity rises again to values around 36. I by
1200 m depth and then decreases again to around 25 per mil. Oxygen content
behaves in exactly the opposite fashion. The lowest observed oxygen contents and
highest salinities can be correlated with the horizon of flow of Mediterranean
waters into the Atlantic. The end values vary over the whole water profile by
about 2.7 e units (Fig. 5.30). The uppermost 500 m of the water column show end
values between -11.5 und -12.5. At depths greater than 500 m, these values rise
reaching maximum values of around -9.8 +/- 0.6 at about 1000 m depth. At this
depth, the eNd values fall again. The Sm und Nd concentrations are likewise
dependent on water depth and rise with increasing depth (Fig. 5.31). The
maximum eNd values between depths of 800 and 1000 m can easily be
differentiated from the other Nd isotopic ratios of the water profile.