

5 Isotopic Composition of Seawater 107
It is interesting that the authors did not consider an oceanic hydrothermal
component in their mass balance, although this can be taken as part of "V". The
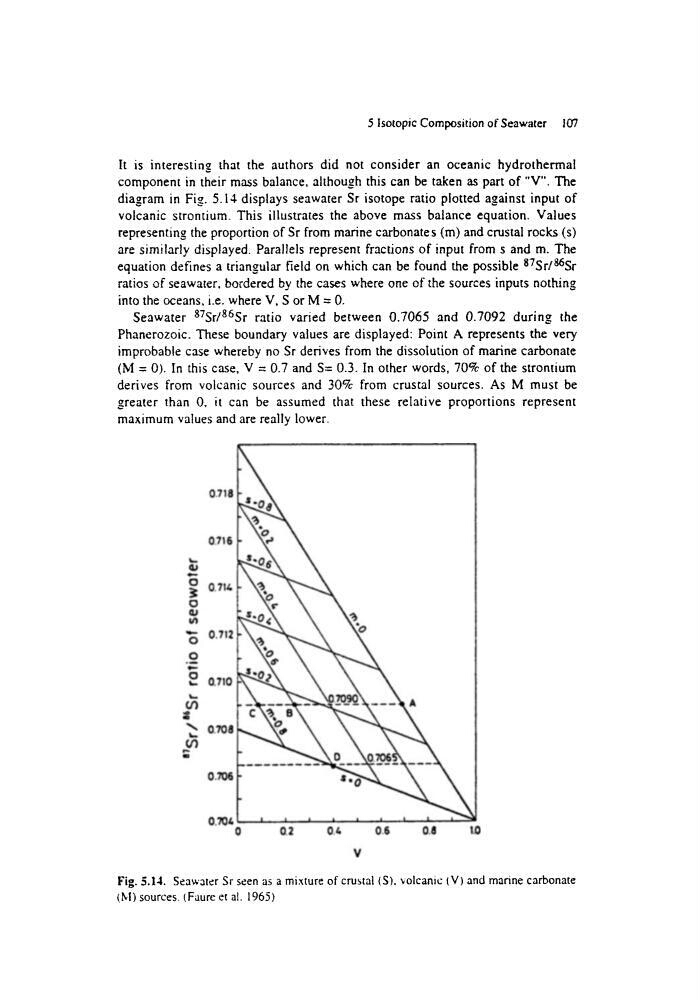
diagram in Fig. 5.14 displays seawater Sr isotope ratio plotted against input of
volcanic strontium. This illustrates the above mass balance equation. Values
representing the proportion of Sr from marine carbonates (m) and crustal rocks (s)
are similarly displayed. Parallels represent fractions of input from s and m. The
equation defines a triangular field on which can be found the possible 87Sr/86Sr
ratios of seawater, bordered by the cases where one of the sources inputs nothing
into the oceans, i.e. where V, S or M = 0.
Seawater 87Sr/86Sr ratio varied between 0.7065 and 0.7092 during the
Phanerozoic. These boundary values are displayed: Point A represents the very
improbable case whereby no Sr derives from the dissolution of marine carbonate
(M = 0). In this case, V = 0.7 and S= 0.3. In other words, 70% of the strontium
derives from volcanic sources and 30% from crustal sources. As M must be
greater than 0, it can be assumed that these relative proportions represent
maximum values and are really lower.
0.718
0.716
o 9 0.71z.
c3
t/3
~ - 0.712
o
o
0310
0.7O8
0.706
0.?04
0
0.2
0.~.
0,6
0.8
1.0
V
Fig. 5.14. Seawater Sr seen as a mixture of crustal (S). ',olcanic (V) and marine carbonate
(M) sources. (Faure et al. 1965)
It is interesting that the authors did not consider an oceanic hydrothermal
component in their mass balance, although this can be taken as part of "V". The
diagram in Fig. 5.14 displays seawater Sr isotope ratio plotted against input of
volcanic strontium. This illustrates the above mass balance equation. Values
representing the proportion of Sr from marine carbonates (m) and crustal rocks (s)
are similarly displayed. Parallels represent fractions of input from s and m. The
equation defines a triangular field on which can be found the possible 87Sr/86Sr
ratios of seawater, bordered by the cases where one of the sources inputs nothing
into the oceans, i.e. where V, S or M = 0.
Seawater 87Sr/86Sr ratio varied between 0.7065 and 0.7092 during the
Phanerozoic. These boundary values are displayed: Point A represents the very
improbable case whereby no Sr derives from the dissolution of marine carbonate
(M = 0). In this case, V = 0.7 and S= 0.3. In other words, 70% of the strontium
derives from volcanic sources and 30% from crustal sources. As M must be
greater than 0, it can be assumed that these relative proportions represent
maximum values and are really lower.
0.718
0.716
o 9 0.71z.
c3
t/3
~ - 0.712
o
o
0310
0.7O8
0.706
0.?04
0
0.2
0.~.
0,6
0.8
1.0
V
Fig. 5.14. Seawater Sr seen as a mixture of crustal (S). ',olcanic (V) and marine carbonate
(M) sources. (Faure et al. 1965)