

75
analyzing low concentrations obtained from small
sample amounts. Actually, one would prefer to
gain all results by in situ measurements at the
bottom of the ocean, which is feasible, however,
only in very few exceptional cases.
3.1
Introduction:
How to Read Pore Water
Concentration Profiles
The processes of early diagenesis - irrespective
of whether we are dealing with microbiological
redox-reactions or predominantly abiotic reactions of dissolution and precipitation - are
invariably reflected in the pore water of sediments. The aquatic phase of the sediments is the
site where the reactions occur, and where they
become visible as time-dependent or spatial
distributions of concentrations. Thus, if the early
diagenesis processes are to be examined and
quantified in the young marine sediment, the
foremost step will always consist of measuring
the concentration profiles in the pore water
fraction.
For reasons of simplification and enabling an
easy understanding of the matter, only three
fundamental processes will be considered in this
section, along with their manifestation in the pore
water concentration profiles:
• Consumption of a reactant in pore water (e.g.
consumption of oxygen in the course of
oxidizing organic material)
• Release of a substance from the solid phase
into the pore water fraction (e.g. release of
silica due to the dissolution of opal).
• Diffusion transport of dissolved substances in
pore water and across the sediment/ bottom
water boundary.
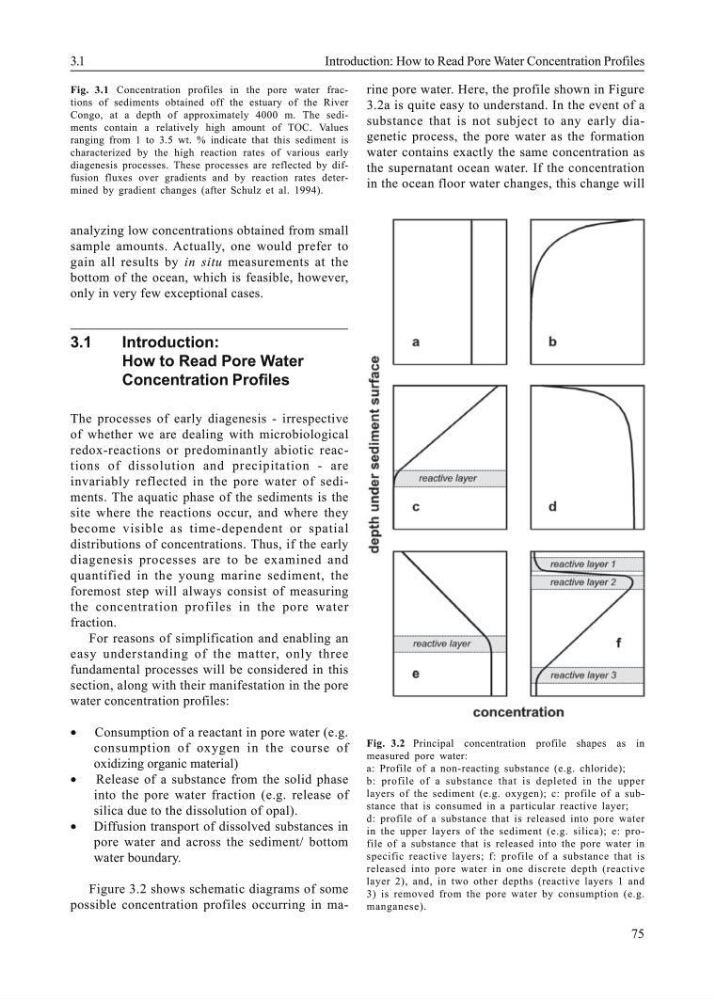
Figure 3.2 shows schematic diagrams of some
possible concentration profiles occurring in marine pore water. Here, the profile shown in Figure
3.2a is quite easy to understand. In the event of a
substance that is not subject to any early diagenetic process, the pore water as the formation
water contains exactly the same concentration as
the supernatant ocean water. If the concentration
in the ocean floor water changes, this change will
3.1
Introduction: How to Read Pore Water Concentration Profiles
Fig. 3.1 Concentration profiles in the pore water fractions of sediments obtained off the estuary of the River
Congo, at a depth of approximately 4000 m. The sediments contain a relatively high amount of TOC. Values
ranging from 1 to 3.5 wt. % indicate that this sediment is
characterized by the high reaction rates of various early
diagenesis processes. These processes are reflected by diffusion fluxes over gradients and by reaction rates determined by gradient changes (after Schulz et al. 1994).
Fig. 3.2 Principal concentration profile shapes as in
measured pore water:
a: Profile of a non-reacting substance (e.g. chloride);
b: profile of a substance that is depleted in the upper
layers of the sediment (e.g. oxygen); c: profile of a substance that is consumed in a particular reactive layer;
d: profile of a substance that is released into pore water
in the upper layers of the sediment (e.g. silica); e: profile of a substance that is released into the pore water in
specific reactive layers; f: profile of a substance that is
released into pore water in one discrete depth (reactive
layer 2), and, in two other depths (reactive layers 1 and
3) is removed from the pore water by consumption (e.g.
manganese).
analyzing low concentrations obtained from small
sample amounts. Actually, one would prefer to
gain all results by in situ measurements at the
bottom of the ocean, which is feasible, however,
only in very few exceptional cases.
3.1
Introduction:
How to Read Pore Water
Concentration Profiles
The processes of early diagenesis - irrespective
of whether we are dealing with microbiological
redox-reactions or predominantly abiotic reactions of dissolution and precipitation - are
invariably reflected in the pore water of sediments. The aquatic phase of the sediments is the
site where the reactions occur, and where they
become visible as time-dependent or spatial
distributions of concentrations. Thus, if the early
diagenesis processes are to be examined and
quantified in the young marine sediment, the
foremost step will always consist of measuring
the concentration profiles in the pore water
fraction.
For reasons of simplification and enabling an
easy understanding of the matter, only three
fundamental processes will be considered in this
section, along with their manifestation in the pore
water concentration profiles:
• Consumption of a reactant in pore water (e.g.
consumption of oxygen in the course of
oxidizing organic material)
• Release of a substance from the solid phase
into the pore water fraction (e.g. release of
silica due to the dissolution of opal).
• Diffusion transport of dissolved substances in
pore water and across the sediment/ bottom
water boundary.
Figure 3.2 shows schematic diagrams of some
possible concentration profiles occurring in marine pore water. Here, the profile shown in Figure
3.2a is quite easy to understand. In the event of a
substance that is not subject to any early diagenetic process, the pore water as the formation
water contains exactly the same concentration as
the supernatant ocean water. If the concentration
in the ocean floor water changes, this change will
3.1
Introduction: How to Read Pore Water Concentration Profiles
Fig. 3.1 Concentration profiles in the pore water fractions of sediments obtained off the estuary of the River
Congo, at a depth of approximately 4000 m. The sediments contain a relatively high amount of TOC. Values
ranging from 1 to 3.5 wt. % indicate that this sediment is
characterized by the high reaction rates of various early
diagenesis processes. These processes are reflected by diffusion fluxes over gradients and by reaction rates determined by gradient changes (after Schulz et al. 1994).
Fig. 3.2 Principal concentration profile shapes as in
measured pore water:
a: Profile of a non-reacting substance (e.g. chloride);
b: profile of a substance that is depleted in the upper
layers of the sediment (e.g. oxygen); c: profile of a substance that is consumed in a particular reactive layer;
d: profile of a substance that is released into pore water
in the upper layers of the sediment (e.g. silica); e: profile of a substance that is released into the pore water in
specific reactive layers; f: profile of a substance that is
released into pore water in one discrete depth (reactive
layer 2), and, in two other depths (reactive layers 1 and
3) is removed from the pore water by consumption (e.g.
manganese).