

41
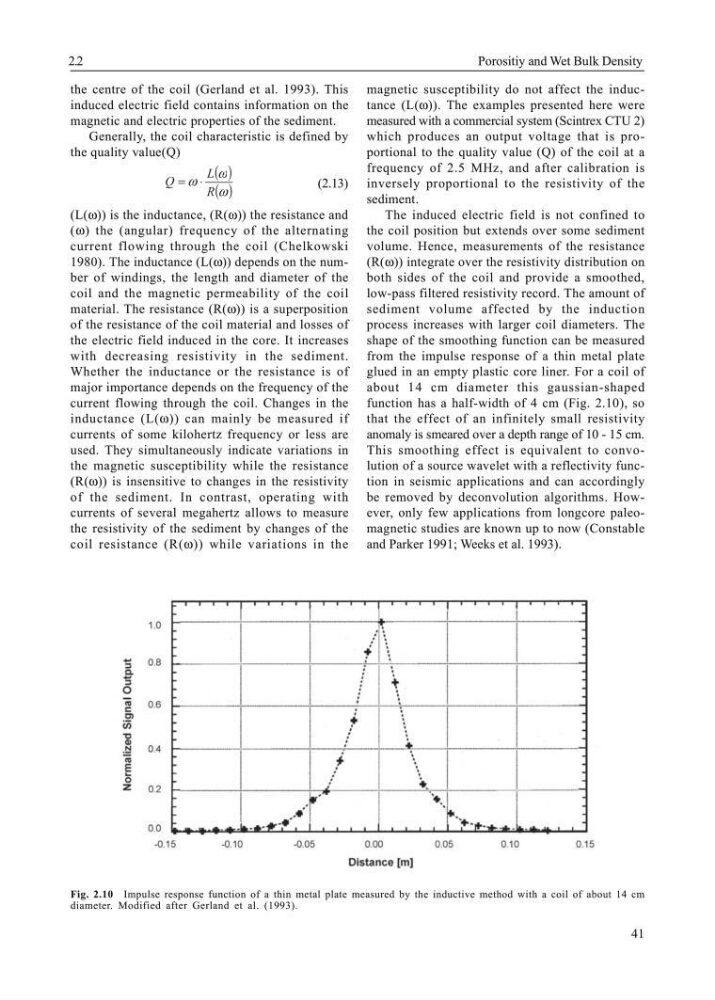
Fig. 2.10 Impulse response function of a thin metal plate measured by the inductive method with a coil of about 14 cm
diameter. Modified after Gerland et al. (1993).
the centre of the coil (Gerland et al. 1993). This
induced electric field contains information on the
magnetic and electric properties of the sediment.
Generally, the coil characteristic is defined by
the quality value(Q)
( )
( )
ω
ω
ω R
L
Q
⋅
=
(2.13)
(L(ω)) is the inductance, (R(ω)) the resistance and
(ω) the (angular) frequency of the alternating
current flowing through the coil (Chelkowski
1980). The inductance (L(ω)) depends on the number of windings, the length and diameter of the
coil and the magnetic permeability of the coil
material. The resistance (R(ω)) is a superposition
of the resistance of the coil material and losses of
the electric field induced in the core. It increases
with decreasing resistivity in the sediment.
Whether the inductance or the resistance is of
major importance depends on the frequency of the
current flowing through the coil. Changes in the
inductance (L(ω)) can mainly be measured if
currents of some kilohertz frequency or less are
used. They simultaneously indicate variations in
the magnetic susceptibility while the resistance
(R(ω)) is insensitive to changes in the resistivity
of the sediment. In contrast, operating with
currents of several megahertz allows to measure
the resistivity of the sediment by changes of the
coil resistance (R(ω)) while variations in the
magnetic susceptibility do not affect the inductance (L(ω)). The examples presented here were
measured with a commercial system (Scintrex CTU 2)
which produces an output voltage that is proportional to the quality value (Q) of the coil at a
frequency of 2.5 MHz, and after calibration is
inversely proportional to the resistivity of the
sediment.
The induced electric field is not confined to
the coil position but extends over some sediment
volume. Hence, measurements of the resistance
(R(ω)) integrate over the resistivity distribution on
both sides of the coil and provide a smoothed,
low-pass filtered resistivity record. The amount of
sediment volume affected by the induction
process increases with larger coil diameters. The
shape of the smoothing function can be measured
from the impulse response of a thin metal plate
glued in an empty plastic core liner. For a coil of
about 14 cm diameter this gaussian-shaped
function has a half-width of 4 cm (Fig. 2.10), so
that the effect of an infinitely small resistivity
anomaly is smeared over a depth range of 10 - 15 cm.
This smoothing effect is equivalent to convolution of a source wavelet with a reflectivity function in seismic applications and can accordingly
be removed by deconvolution algorithms. However, only few applications from longcore paleomagnetic studies are known up to now (Constable
and Parker 1991; Weeks et al. 1993).
2.2
Porositiy and Wet Bulk Density
Fig. 2.10 Impulse response function of a thin metal plate measured by the inductive method with a coil of about 14 cm
diameter. Modified after Gerland et al. (1993).
the centre of the coil (Gerland et al. 1993). This
induced electric field contains information on the
magnetic and electric properties of the sediment.
Generally, the coil characteristic is defined by
the quality value(Q)
( )
( )
ω
ω
ω R
L
Q
⋅
=
(2.13)
(L(ω)) is the inductance, (R(ω)) the resistance and
(ω) the (angular) frequency of the alternating
current flowing through the coil (Chelkowski
1980). The inductance (L(ω)) depends on the number of windings, the length and diameter of the
coil and the magnetic permeability of the coil
material. The resistance (R(ω)) is a superposition
of the resistance of the coil material and losses of
the electric field induced in the core. It increases
with decreasing resistivity in the sediment.
Whether the inductance or the resistance is of
major importance depends on the frequency of the
current flowing through the coil. Changes in the
inductance (L(ω)) can mainly be measured if
currents of some kilohertz frequency or less are
used. They simultaneously indicate variations in
the magnetic susceptibility while the resistance
(R(ω)) is insensitive to changes in the resistivity
of the sediment. In contrast, operating with
currents of several megahertz allows to measure
the resistivity of the sediment by changes of the
coil resistance (R(ω)) while variations in the
magnetic susceptibility do not affect the inductance (L(ω)). The examples presented here were
measured with a commercial system (Scintrex CTU 2)
which produces an output voltage that is proportional to the quality value (Q) of the coil at a
frequency of 2.5 MHz, and after calibration is
inversely proportional to the resistivity of the
sediment.
The induced electric field is not confined to
the coil position but extends over some sediment
volume. Hence, measurements of the resistance
(R(ω)) integrate over the resistivity distribution on
both sides of the coil and provide a smoothed,
low-pass filtered resistivity record. The amount of
sediment volume affected by the induction
process increases with larger coil diameters. The
shape of the smoothing function can be measured
from the impulse response of a thin metal plate
glued in an empty plastic core liner. For a coil of
about 14 cm diameter this gaussian-shaped
function has a half-width of 4 cm (Fig. 2.10), so
that the effect of an infinitely small resistivity
anomaly is smeared over a depth range of 10 - 15 cm.
This smoothing effect is equivalent to convolution of a source wavelet with a reflectivity function in seismic applications and can accordingly
be removed by deconvolution algorithms. However, only few applications from longcore paleomagnetic studies are known up to now (Constable
and Parker 1991; Weeks et al. 1993).
2.2
Porositiy and Wet Bulk Density