

404
11 Manganese: Predominant Role of Nodules and Crusts
sition was again similar to that below 40 mm reflecting
the weak influence of AABW at present.
10
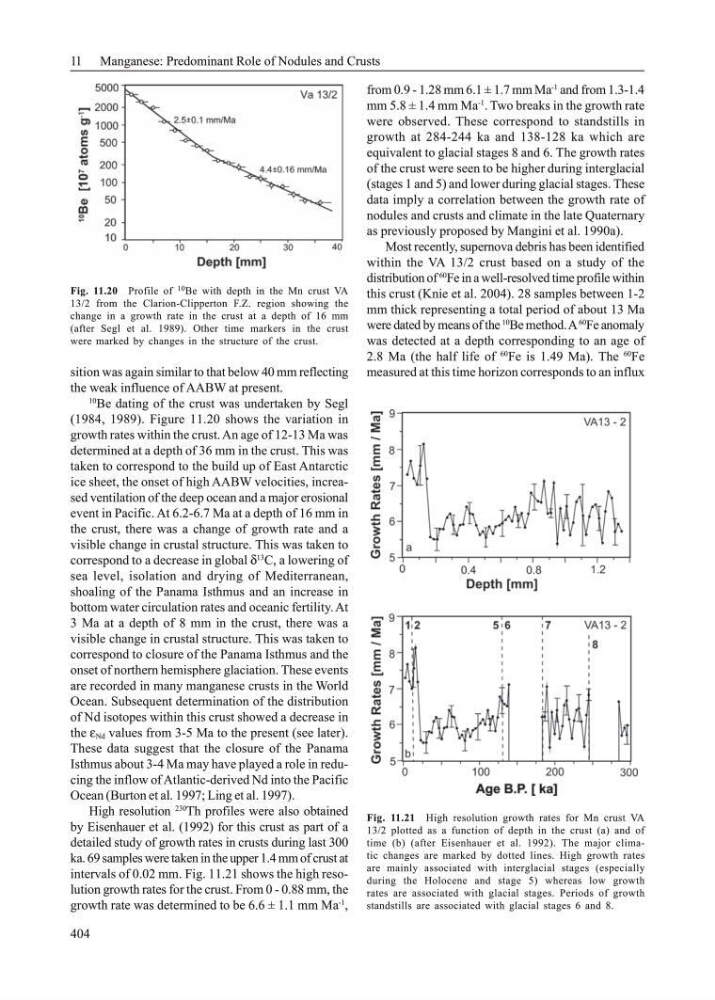
Be dating of the crust was undertaken by Segl
(1984, 1989). Figure 11.20 shows the variation in
growth rates within the crust. An age of 12-13 Ma was
determined at a depth of 36 mm in the crust. This was
taken to correspond to the build up of East Antarctic
ice sheet, the onset of high AABW velocities, increased ventilation of the deep ocean and a major erosional
event in Pacific. At 6.2-6.7 Ma at a depth of 16 mm in
the crust, there was a change of growth rate and a
visible change in crustal structure. This was taken to
correspond to a decrease in global δ
13
C, a lowering of
sea level, isolation and drying of Mediterranean,
shoaling of the Panama Isthmus and an increase in
bottom water circulation rates and oceanic fertility. At
3 Ma at a depth of 8 mm in the crust, there was a
visible change in crustal structure. This was taken to
correspond to closure of the Panama Isthmus and the
onset of northern hemisphere glaciation. These events
are recorded in many manganese crusts in the World
Ocean. Subsequent determination of the distribution
of Nd isotopes within this crust showed a decrease in
the ε Nd values from 3-5 Ma to the present (see later).
These data suggest that the closure of the Panama
Isthmus about 3-4 Ma may have played a role in reducing the inflow of Atlantic-derived Nd into the Pacific
Ocean (Burton et al. 1997; Ling et al. 1997).
High resolution
230
Th profiles were also obtained
by Eisenhauer et al. (1992) for this crust as part of a
detailed study of growth rates in crusts during last 300
ka. 69 samples were taken in the upper 1.4 mm of crust at
intervals of 0.02 mm. Fig. 11.21 shows the high resolution growth rates for the crust. From 0 - 0.88 mm, the
growth rate was determined to be 6.6 ± 1.1 mm Ma
-1
,
from 0.9 - 1.28 mm 6.1 ± 1.7 mm Ma
-1
and from 1.3-1.4
mm 5.8 ± 1.4 mm Ma
-1
. Two breaks in the growth rate
were observed. These correspond to standstills in
growth at 284-244 ka and 138-128 ka which are
equivalent to glacial stages 8 and 6. The growth rates
of the crust were seen to be higher during interglacial
(stages 1 and 5) and lower during glacial stages. These
data imply a correlation between the growth rate of
nodules and crusts and climate in the late Quaternary
as previously proposed by Mangini et al. 1990a).
Most recently, supernova debris has been identified
within the VA 13/2 crust based on a study of the
distribution of
60
Fe in a well-resolved time profile within
this crust (Knie et al. 2004). 28 samples between 1-2
mm thick representing a total period of about 13 Ma
were dated by means of the
10
Be method. A
60
Fe anomaly
was detected at a depth corresponding to an age of
2.8 Ma (the half life of
60
Fe is 1.49 Ma). The
60
Fe
measured at this time horizon corresponds to an influx
Fig. 11.21 High resolution growth rates for Mn crust VA
13/2 plotted as a function of depth in the crust (a) and of
time (b) (after Eisenhauer et al. 1992). The major climatic changes are marked by dotted lines. High growth rates
are mainly associated with interglacial stages (especially
during the Holocene and stage 5) whereas low growth
rates are associated with glacial stages. Periods of growth
standstills are associated with glacial stages 6 and 8.
Fig. 11.20 Profile of 10 Be with depth in the Mn crust VA
13/2 from the Clarion-Clipperton F.Z. region showing the
change in a growth rate in the crust at a depth of 16 mm
(after Segl et al. 1989). Other time markers in the crust
were marked by changes in the structure of the crust.
11 Manganese: Predominant Role of Nodules and Crusts
sition was again similar to that below 40 mm reflecting
the weak influence of AABW at present.
10
Be dating of the crust was undertaken by Segl
(1984, 1989). Figure 11.20 shows the variation in
growth rates within the crust. An age of 12-13 Ma was
determined at a depth of 36 mm in the crust. This was
taken to correspond to the build up of East Antarctic
ice sheet, the onset of high AABW velocities, increased ventilation of the deep ocean and a major erosional
event in Pacific. At 6.2-6.7 Ma at a depth of 16 mm in
the crust, there was a change of growth rate and a
visible change in crustal structure. This was taken to
correspond to a decrease in global δ
13
C, a lowering of
sea level, isolation and drying of Mediterranean,
shoaling of the Panama Isthmus and an increase in
bottom water circulation rates and oceanic fertility. At
3 Ma at a depth of 8 mm in the crust, there was a
visible change in crustal structure. This was taken to
correspond to closure of the Panama Isthmus and the
onset of northern hemisphere glaciation. These events
are recorded in many manganese crusts in the World
Ocean. Subsequent determination of the distribution
of Nd isotopes within this crust showed a decrease in
the ε Nd values from 3-5 Ma to the present (see later).
These data suggest that the closure of the Panama
Isthmus about 3-4 Ma may have played a role in reducing the inflow of Atlantic-derived Nd into the Pacific
Ocean (Burton et al. 1997; Ling et al. 1997).
High resolution
230
Th profiles were also obtained
by Eisenhauer et al. (1992) for this crust as part of a
detailed study of growth rates in crusts during last 300
ka. 69 samples were taken in the upper 1.4 mm of crust at
intervals of 0.02 mm. Fig. 11.21 shows the high resolution growth rates for the crust. From 0 - 0.88 mm, the
growth rate was determined to be 6.6 ± 1.1 mm Ma
-1
,
from 0.9 - 1.28 mm 6.1 ± 1.7 mm Ma
-1
and from 1.3-1.4
mm 5.8 ± 1.4 mm Ma
-1
. Two breaks in the growth rate
were observed. These correspond to standstills in
growth at 284-244 ka and 138-128 ka which are
equivalent to glacial stages 8 and 6. The growth rates
of the crust were seen to be higher during interglacial
(stages 1 and 5) and lower during glacial stages. These
data imply a correlation between the growth rate of
nodules and crusts and climate in the late Quaternary
as previously proposed by Mangini et al. 1990a).
Most recently, supernova debris has been identified
within the VA 13/2 crust based on a study of the
distribution of
60
Fe in a well-resolved time profile within
this crust (Knie et al. 2004). 28 samples between 1-2
mm thick representing a total period of about 13 Ma
were dated by means of the
10
Be method. A
60
Fe anomaly
was detected at a depth corresponding to an age of
2.8 Ma (the half life of
60
Fe is 1.49 Ma). The
60
Fe
measured at this time horizon corresponds to an influx
Fig. 11.21 High resolution growth rates for Mn crust VA
13/2 plotted as a function of depth in the crust (a) and of
time (b) (after Eisenhauer et al. 1992). The major climatic changes are marked by dotted lines. High growth rates
are mainly associated with interglacial stages (especially
during the Holocene and stage 5) whereas low growth
rates are associated with glacial stages. Periods of growth
standstills are associated with glacial stages 6 and 8.
Fig. 11.20 Profile of 10 Be with depth in the Mn crust VA
13/2 from the Clarion-Clipperton F.Z. region showing the
change in a growth rate in the crust at a depth of 16 mm
(after Segl et al. 1989). Other time markers in the crust
were marked by changes in the structure of the crust.