

9
Marine Carbonates: Their Formation and Destruction
314
Their areas amount to 15 and 10⋅10
12
km
2
,
respectively (Hay and Southam 1977). However
for the two shelf types well-constrained estimates
of how much carbonate is produced are missing.
In the context of shelves it may be important to
separate two other specific bioherms which could
have a great potential in shallow-water carbonate
production. These are sedimentary carbonates exclusively built up by the calcareous green algae
Halimeda in tropical latitudes (e.g. Roberts and
Macintyre 1988) and extensive biotic cold-water
carbonate reefs or banks as described above for
mid to high latitudes. For Halimeda bioherms total
carbonate production and accumulation is about
1.5⋅10
12
mol yr
-1
(Table 9.1) while the estimates for
open shelves given by Wollast (1994) and
Milliman and Droxler (1996) do not differentiate a
budget for cold-water shelf areas on its own. Mean
carbonate production on lower-latitude shelf areas
may range between 50 and 100 g m
-2
yr
-1
(Table 9.1);
in total 6⋅10
12
mol yr
-1
. How much of this annual
production actually accumulates, is dissolved or
exported to the deep-sea remains questionable,
because shelf sediments are commonly a mixture of
modern and relictic components. Moreover,
accumulation rates on broad sandy shelves like
that off Argentina are not well-known, because
they have not been investigated in such detail yet
as other shelf environments. According to
Milliman and Droxler (1996) half of the production
on carbonate-rich shelves is accumulating (3⋅10
12
mol yr
-1
; Table 9.1) while the other half is either
transported downslope to the deep sea or dissolved. For carbonate-poor shelves carbonate
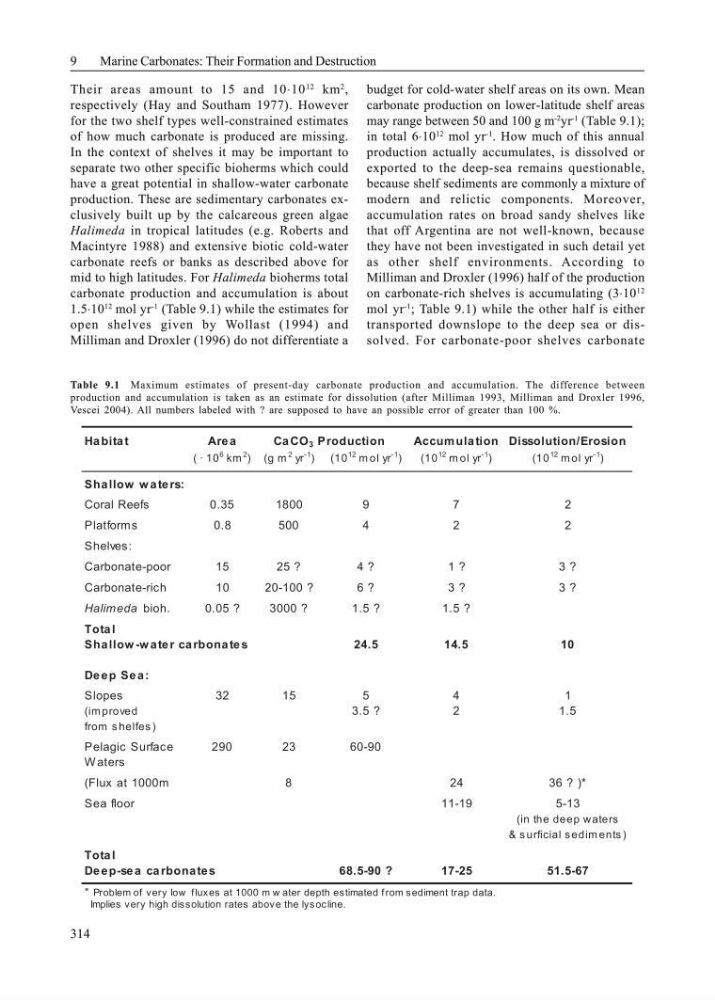
Table 9.1 Maximum estimates of present-day carbonate production and accumulation. The difference between
production and accumulation is taken as an estimate for dissolution (after Milliman 1993, Milliman and Droxler 1996,
Vescei 2004). All numbers labeled with ? are supposed to have an possible error of greater than 100 %.
Ha bita t
Are a
Ca CO 3 Production
Accum ula tion Dissolution/Erosion
( · 10
6 km
2
) (g m
2 yr
-1
) (10
12 m ol yr
-1
)
(10
12 m ol yr
-1
)
( 1 0
12 m ol yr
-1
)
Shallow w aters:
Coral Reefs
0.35
1800
9
7
2
Platforms
0.8
500
4
2
2
Shelves:
Carbonate-poor
15
25 ?
4 ?
1 ?
3 ?
Carbonate-rich
10
20-100 ?
6 ?
3 ?
3 ?
Halimeda bioh.
0.05 ?
3000 ?
1.5 ?
1.5 ?
Tota l
Sha llow -w a te r ca rbona te s
24.5
14.5
10
De e p Se a :
Slopes
32
15
5
4
1
(im proved
3.5 ?
2
1.5
from s helfes )
Pelagic Surface
290
23
60-90
W aters
(Flux at 1000m
8
24
36 ? )*
Sea floor
11-19
5-13
(in the deep waters
& s urficial s edim ents )
Tota l
De e p-se a ca rbona te s
68.5-90 ?
17-25
51.5-67
* Problem of very low f luxes at 1000 m w ater depth estimated from sediment trap data.
Implies very high dissolution rates above the lysocline.
Marine Carbonates: Their Formation and Destruction
314
Their areas amount to 15 and 10⋅10
12
km
2
,
respectively (Hay and Southam 1977). However
for the two shelf types well-constrained estimates
of how much carbonate is produced are missing.
In the context of shelves it may be important to
separate two other specific bioherms which could
have a great potential in shallow-water carbonate
production. These are sedimentary carbonates exclusively built up by the calcareous green algae
Halimeda in tropical latitudes (e.g. Roberts and
Macintyre 1988) and extensive biotic cold-water
carbonate reefs or banks as described above for
mid to high latitudes. For Halimeda bioherms total
carbonate production and accumulation is about
1.5⋅10
12
mol yr
-1
(Table 9.1) while the estimates for
open shelves given by Wollast (1994) and
Milliman and Droxler (1996) do not differentiate a
budget for cold-water shelf areas on its own. Mean
carbonate production on lower-latitude shelf areas
may range between 50 and 100 g m
-2
yr
-1
(Table 9.1);
in total 6⋅10
12
mol yr
-1
. How much of this annual
production actually accumulates, is dissolved or
exported to the deep-sea remains questionable,
because shelf sediments are commonly a mixture of
modern and relictic components. Moreover,
accumulation rates on broad sandy shelves like
that off Argentina are not well-known, because
they have not been investigated in such detail yet
as other shelf environments. According to
Milliman and Droxler (1996) half of the production
on carbonate-rich shelves is accumulating (3⋅10
12
mol yr
-1
; Table 9.1) while the other half is either
transported downslope to the deep sea or dissolved. For carbonate-poor shelves carbonate
Table 9.1 Maximum estimates of present-day carbonate production and accumulation. The difference between
production and accumulation is taken as an estimate for dissolution (after Milliman 1993, Milliman and Droxler 1996,
Vescei 2004). All numbers labeled with ? are supposed to have an possible error of greater than 100 %.
Ha bita t
Are a
Ca CO 3 Production
Accum ula tion Dissolution/Erosion
( · 10
6 km
2
) (g m
2 yr
-1
) (10
12 m ol yr
-1
)
(10
12 m ol yr
-1
)
( 1 0
12 m ol yr
-1
)
Shallow w aters:
Coral Reefs
0.35
1800
9
7
2
Platforms
0.8
500
4
2
2
Shelves:
Carbonate-poor
15
25 ?
4 ?
1 ?
3 ?
Carbonate-rich
10
20-100 ?
6 ?
3 ?
3 ?
Halimeda bioh.
0.05 ?
3000 ?
1.5 ?
1.5 ?
Tota l
Sha llow -w a te r ca rbona te s
24.5
14.5
10
De e p Se a :
Slopes
32
15
5
4
1
(im proved
3.5 ?
2
1.5
from s helfes )
Pelagic Surface
290
23
60-90
W aters
(Flux at 1000m
8
24
36 ? )*
Sea floor
11-19
5-13
(in the deep waters
& s urficial s edim ents )
Tota l
De e p-se a ca rbona te s
68.5-90 ?
17-25
51.5-67
* Problem of very low f luxes at 1000 m w ater depth estimated from sediment trap data.
Implies very high dissolution rates above the lysocline.