

118
3
Quantification of Early Diagenesis: Dissolved Constituents in Marine Pore Water
chemical extraction and analysis - provided that
all steps of extraction and analysis are automated.
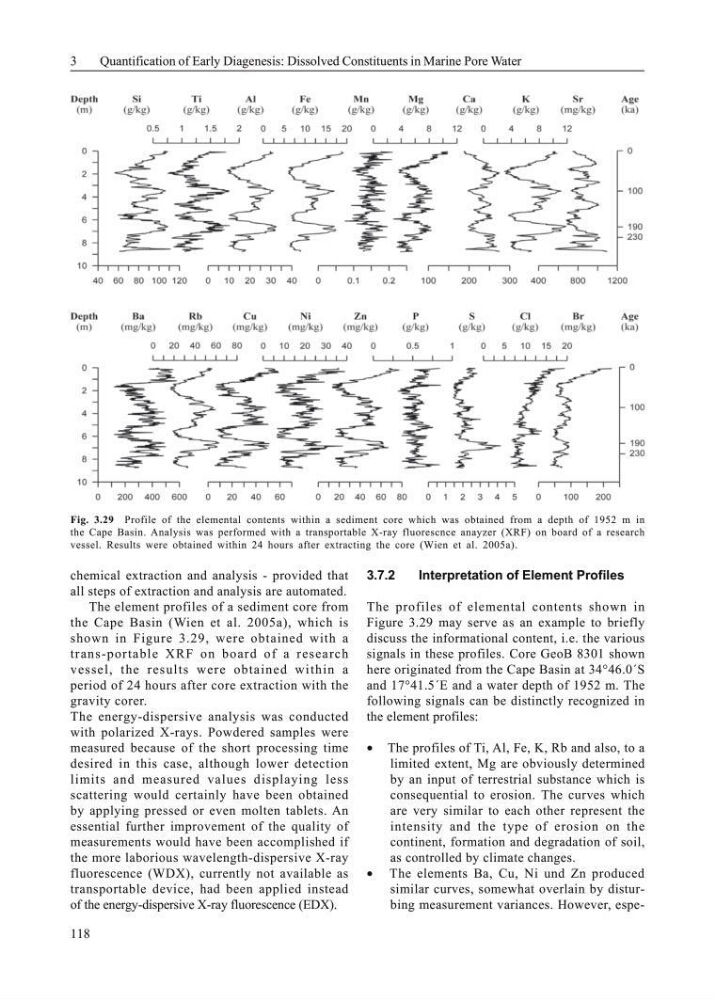
The element profiles of a sediment core from
the Cape Basin (Wien et al. 2005a), which is
shown in Figure 3.29, were obtained with a
trans-portable XRF on board of a research
vessel, the results were obtained within a
period of 24 hours after core extraction with the
gravity corer.
The energy-dispersive analysis was conducted
with polarized X-rays. Powdered samples were
measured because of the short processing time
desired in this case, although lower detection
limits and measured values displaying less
scattering would certainly have been obtained
by applying pressed or even molten tablets. An
essential further improvement of the quality of
measurements would have been accomplished if
the more laborious wavelength-dispersive X-ray
fluorescence (WDX), currently not available as
transportable device, had been applied instead
of the energy-dispersive X-ray fluorescence (EDX).
3.7.2
Interpretation of Element Profiles
The profiles of elemental contents shown in
Figure 3.29 may serve as an example to briefly
discuss the informational content, i.e. the various
signals in these profiles. Core GeoB 8301 shown
here originated from the Cape Basin at 34°46.0´S
and 17°41.5´E and a water depth of 1952 m. The
following signals can be distinctly recognized in
the element profiles:
• The profiles of Ti, Al, Fe, K, Rb and also, to a
limited extent, Mg are obviously determined
by an input of terrestrial substance which is
consequential to erosion. The curves which
are very similar to each other represent the
intensity and the type of erosion on the
continent, formation and degradation of soil,
as controlled by climate changes.
• The elements Ba, Cu, Ni und Zn produced
similar curves, somewhat overlain by disturbing measurement variances. However, espeFig. 3.29 Profile of the elemental contents within a sediment core which was obtained from a depth of 1952 m in
the Cape Basin. Analysis was performed with a transportable X-ray fluorescnce anayzer (XRF) on board of a research
vessel. Results were obtained within 24 hours after extracting the core (Wien et al. 2005a).
3
Quantification of Early Diagenesis: Dissolved Constituents in Marine Pore Water
chemical extraction and analysis - provided that
all steps of extraction and analysis are automated.
The element profiles of a sediment core from
the Cape Basin (Wien et al. 2005a), which is
shown in Figure 3.29, were obtained with a
trans-portable XRF on board of a research
vessel, the results were obtained within a
period of 24 hours after core extraction with the
gravity corer.
The energy-dispersive analysis was conducted
with polarized X-rays. Powdered samples were
measured because of the short processing time
desired in this case, although lower detection
limits and measured values displaying less
scattering would certainly have been obtained
by applying pressed or even molten tablets. An
essential further improvement of the quality of
measurements would have been accomplished if
the more laborious wavelength-dispersive X-ray
fluorescence (WDX), currently not available as
transportable device, had been applied instead
of the energy-dispersive X-ray fluorescence (EDX).
3.7.2
Interpretation of Element Profiles
The profiles of elemental contents shown in
Figure 3.29 may serve as an example to briefly
discuss the informational content, i.e. the various
signals in these profiles. Core GeoB 8301 shown
here originated from the Cape Basin at 34°46.0´S
and 17°41.5´E and a water depth of 1952 m. The
following signals can be distinctly recognized in
the element profiles:
• The profiles of Ti, Al, Fe, K, Rb and also, to a
limited extent, Mg are obviously determined
by an input of terrestrial substance which is
consequential to erosion. The curves which
are very similar to each other represent the
intensity and the type of erosion on the
continent, formation and degradation of soil,
as controlled by climate changes.
• The elements Ba, Cu, Ni und Zn produced
similar curves, somewhat overlain by disturbing measurement variances. However, espeFig. 3.29 Profile of the elemental contents within a sediment core which was obtained from a depth of 1952 m in
the Cape Basin. Analysis was performed with a transportable X-ray fluorescnce anayzer (XRF) on board of a research
vessel. Results were obtained within 24 hours after extracting the core (Wien et al. 2005a).