

(359.2 km
2 ) (Piekarek-Jankowska 1994). The average groundwater discharge is
equal to 0.9 ± 0.8 km
3 year
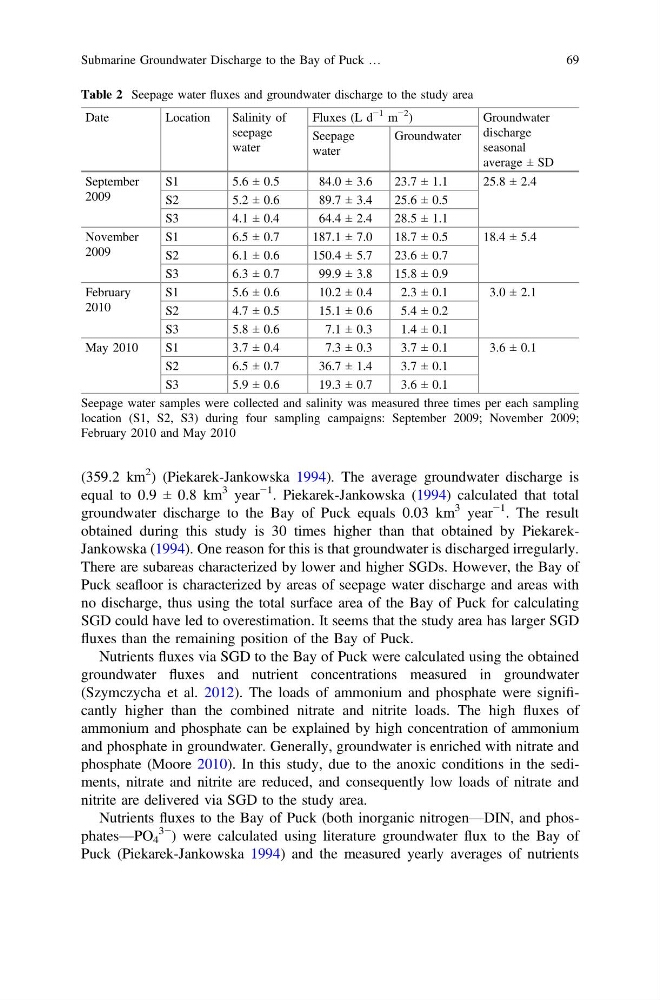
−1 . Piekarek-Jankowska (1994) calculated that total
groundwater discharge to the Bay of Puck equals 0.03 km
3 year
−1 . The result
obtained during this study is 30 times higher than that obtained by PiekarekJankowska (1994). One reason for this is that groundwater is discharged irregularly.
There are subareas characterized by lower and higher SGDs. However, the Bay of
Puck seafloor is characterized by areas of seepage water discharge and areas with
no discharge, thus using the total surface area of the Bay of Puck for calculating
SGD could have led to overestimation. It seems that the study area has larger SGD
fluxes than the remaining position of the Bay of Puck.
Nutrients fluxes via SGD to the Bay of Puck were calculated using the obtained
groundwater fluxes and nutrient concentrations measured in groundwater
(Szymczycha et al. 2012). The loads of ammonium and phosphate were significantly higher than the combined nitrate and nitrite loads. The high fluxes of
ammonium and phosphate can be explained by high concentration of ammonium
and phosphate in groundwater. Generally, groundwater is enriched with nitrate and
phosphate (Moore 2010). In this study, due to the anoxic conditions in the sediments, nitrate and nitrite are reduced, and consequently low loads of nitrate and
nitrite are delivered via SGD to the study area.
Nutrients fluxes to the Bay of Puck (both inorganic nitrogen—DIN, and phosphates—PO 4
3− ) were calculated using literature groundwater flux to the Bay of
Puck (Piekarek-Jankowska 1994) and the measured yearly averages of nutrients
Table 2 Seepage water fluxes and groundwater discharge to the study area
Date
Location
Salinity of
seepage
water
Fluxes (L d
−1 m
−2
)
Groundwater
discharge
seasonal
average ± SD
Seepage
water
Groundwater
September
2009
S1
5.6 ± 0.5
84.0 ± 3.6
23.7 ± 1.1
25.8 ± 2.4
S2
5.2 ± 0.6
89.7 ± 3.4
25.6 ± 0.5
S3
4.1 ± 0.4
64.4 ± 2.4
28.5 ± 1.1
November
2009
S1
6.5 ± 0.7
187.1 ± 7.0
18.7 ± 0.5
18.4 ± 5.4
S2
6.1 ± 0.6
150.4 ± 5.7
23.6 ± 0.7
S3
6.3 ± 0.7
99.9 ± 3.8
15.8 ± 0.9
February
2010
S1
5.6 ± 0.6
10.2 ± 0.4
2.3 ± 0.1
3.0 ± 2.1
S2
4.7 ± 0.5
15.1 ± 0.6
5.4 ± 0.2
S3
5.8 ± 0.6
7.1 ± 0.3
1.4 ± 0.1
May 2010
S1
3.7 ± 0.4
7.3 ± 0.3
3.7 ± 0.1
3.6 ± 0.1
S2
6.5 ± 0.7
36.7 ± 1.4
3.7 ± 0.1
S3
5.9 ± 0.6
19.3 ± 0.7
3.6 ± 0.1
Seepage water samples were collected and salinity was measured three times per each sampling
location (S1, S2, S3) during four sampling campaigns: September 2009; November 2009;
February 2010 and May 2010
Submarine Groundwater Discharge to the Bay of Puck …
69
2 ) (Piekarek-Jankowska 1994). The average groundwater discharge is
equal to 0.9 ± 0.8 km
3 year
−1 . Piekarek-Jankowska (1994) calculated that total
groundwater discharge to the Bay of Puck equals 0.03 km
3 year
−1 . The result
obtained during this study is 30 times higher than that obtained by PiekarekJankowska (1994). One reason for this is that groundwater is discharged irregularly.
There are subareas characterized by lower and higher SGDs. However, the Bay of
Puck seafloor is characterized by areas of seepage water discharge and areas with
no discharge, thus using the total surface area of the Bay of Puck for calculating
SGD could have led to overestimation. It seems that the study area has larger SGD
fluxes than the remaining position of the Bay of Puck.
Nutrients fluxes via SGD to the Bay of Puck were calculated using the obtained
groundwater fluxes and nutrient concentrations measured in groundwater
(Szymczycha et al. 2012). The loads of ammonium and phosphate were significantly higher than the combined nitrate and nitrite loads. The high fluxes of
ammonium and phosphate can be explained by high concentration of ammonium
and phosphate in groundwater. Generally, groundwater is enriched with nitrate and
phosphate (Moore 2010). In this study, due to the anoxic conditions in the sediments, nitrate and nitrite are reduced, and consequently low loads of nitrate and
nitrite are delivered via SGD to the study area.
Nutrients fluxes to the Bay of Puck (both inorganic nitrogen—DIN, and phosphates—PO 4
3− ) were calculated using literature groundwater flux to the Bay of
Puck (Piekarek-Jankowska 1994) and the measured yearly averages of nutrients
Table 2 Seepage water fluxes and groundwater discharge to the study area
Date
Location
Salinity of
seepage
water
Fluxes (L d
−1 m
−2
)
Groundwater
discharge
seasonal
average ± SD
Seepage
water
Groundwater
September
2009
S1
5.6 ± 0.5
84.0 ± 3.6
23.7 ± 1.1
25.8 ± 2.4
S2
5.2 ± 0.6
89.7 ± 3.4
25.6 ± 0.5
S3
4.1 ± 0.4
64.4 ± 2.4
28.5 ± 1.1
November
2009
S1
6.5 ± 0.7
187.1 ± 7.0
18.7 ± 0.5
18.4 ± 5.4
S2
6.1 ± 0.6
150.4 ± 5.7
23.6 ± 0.7
S3
6.3 ± 0.7
99.9 ± 3.8
15.8 ± 0.9
February
2010
S1
5.6 ± 0.6
10.2 ± 0.4
2.3 ± 0.1
3.0 ± 2.1
S2
4.7 ± 0.5
15.1 ± 0.6
5.4 ± 0.2
S3
5.8 ± 0.6
7.1 ± 0.3
1.4 ± 0.1
May 2010
S1
3.7 ± 0.4
7.3 ± 0.3
3.7 ± 0.1
3.6 ± 0.1
S2
6.5 ± 0.7
36.7 ± 1.4
3.7 ± 0.1
S3
5.9 ± 0.6
19.3 ± 0.7
3.6 ± 0.1
Seepage water samples were collected and salinity was measured three times per each sampling
location (S1, S2, S3) during four sampling campaigns: September 2009; November 2009;
February 2010 and May 2010
Submarine Groundwater Discharge to the Bay of Puck …
69