

environmental factors increases the possibility to interpret the study results and to
understand the complexity of ecosystem. This series includes the data on distribution of acoustic backscattering, particles from the LOPC surveys, as well as data
on distribution of temperature, salinity and fluorescence, which were collected
together with the LOPC data. The distribution of temperature (Fig. 5) clearly shows
the presence of hydrological front located in the middle of survey section. The
LOPC data, at the same time, pronounced differences in distribution of particles,
with high abundance of suspended matter in the colder waters which presumably
originated from glacier (Fig. 6). Elevated levels of acoustic backscatter were also
recorded in the same fragment of the study section (Fig. 7). A comparison of
measured and modeled values of backscattering strength indicates that in the glacial
waters there is lack of agreement between two methods (Fig. 8). Modeled values are
much lower than the measured ones.
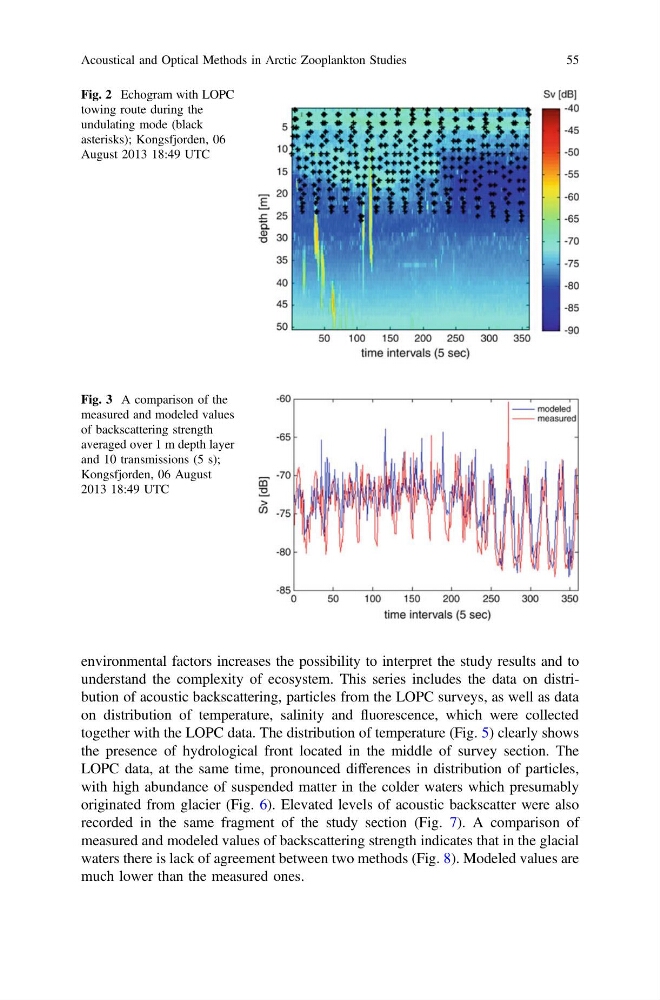
Fig. 2 Echogram with LOPC
towing route during the
undulating mode (black
asterisks); Kongsfjorden, 06
August 2013 18:49 UTC
Fig. 3 A comparison of the
measured and modeled values
of backscattering strength
averaged over 1 m depth layer
and 10 transmissions (5 s);
Kongsfjorden, 06 August
2013 18:49 UTC
Acoustical and Optical Methods in Arctic Zooplankton Studies
55
understand the complexity of ecosystem. This series includes the data on distribution of acoustic backscattering, particles from the LOPC surveys, as well as data
on distribution of temperature, salinity and fluorescence, which were collected
together with the LOPC data. The distribution of temperature (Fig. 5) clearly shows
the presence of hydrological front located in the middle of survey section. The
LOPC data, at the same time, pronounced differences in distribution of particles,
with high abundance of suspended matter in the colder waters which presumably
originated from glacier (Fig. 6). Elevated levels of acoustic backscatter were also
recorded in the same fragment of the study section (Fig. 7). A comparison of
measured and modeled values of backscattering strength indicates that in the glacial
waters there is lack of agreement between two methods (Fig. 8). Modeled values are
much lower than the measured ones.
Fig. 2 Echogram with LOPC
towing route during the
undulating mode (black
asterisks); Kongsfjorden, 06
August 2013 18:49 UTC
Fig. 3 A comparison of the
measured and modeled values
of backscattering strength
averaged over 1 m depth layer
and 10 transmissions (5 s);
Kongsfjorden, 06 August
2013 18:49 UTC
Acoustical and Optical Methods in Arctic Zooplankton Studies
55