

Section 5.4: "Standardization"
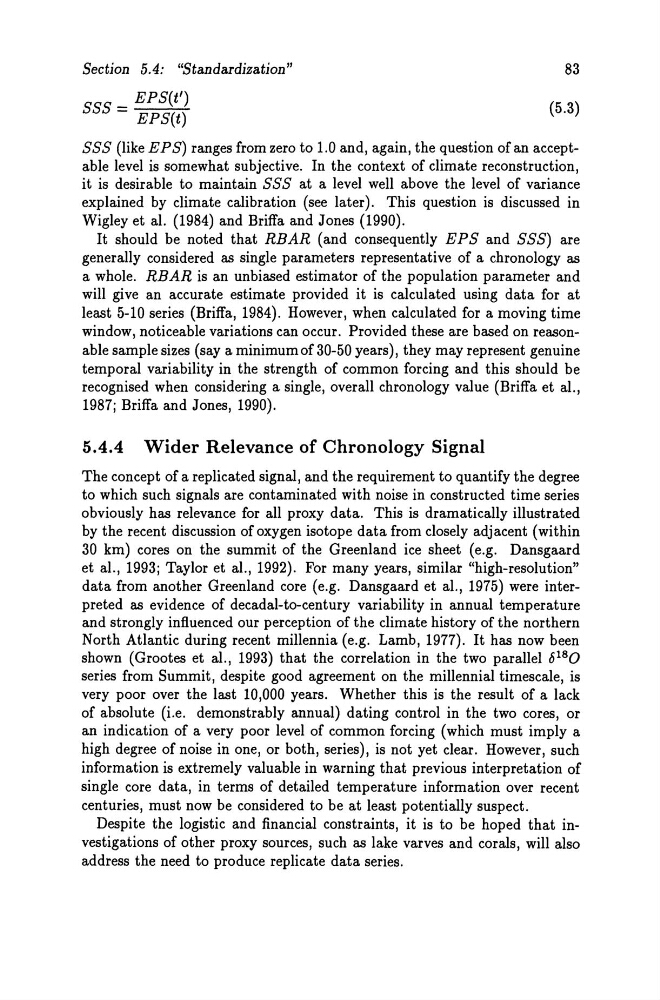
SSS = EPS(t')
EPS(t)
83
(5.3)
SSS (like EP S) ranges from zero to 1.0 and, again, the question of an acceptable level is somewhat subjective. In the context of climate reconstruction,
it is desirable to maintain SSS at a level weIl above the level of variance
explained by climate calibration (see later). This quest ion is discussed in
Wigleyet al. (1984) and Briffa and Jones (1990).
It should be noted that RBAR (and consequently EPS and SSS) are
generally considered as single parameters representative of a chronology as
a whole. RBAR is an unbiased estimator of the population parameter and
will give an accurate estimate provided it is calculated using data for at
least 5-10 series (Briffa, 1984). However, when calculated for a moving time
window, noticeable variations can occur. Provided these are based on reasonable sampie sizes (say a minimumof 30-50 years), they may represent genuine
temporal variability in the strength of common forcing and this should be
recognised when considering a single, overall chronology value (Briffa et al.,
1987; Briffa and Jones, 1990).
5.4.4 Wider Relevance of Chronology Signal
The concept of a replicated signal, and the requirement to quantify the degree
to which such signals are contaminated with noise in constructed time series
obviously has relevance for all proxy data. This is dramatically illustrated
by the re cent discussion of oxygen isotope data from closely adjacent (within
30 km) cores on the summit of the Greenland ice sheet (e.g. Dansgaard
et al. , 1993; Taylor et al. , 1992). For many years, similar "high-resolution"
data from another Greenland core (e.g. Dansgaard et al. , 1975) were interpreted as evidence of decadal-to-century variability in annual temperature
and strongly influenced our perception of the climate history of the northern
North Atlantic during recent millennia (e.g. Lamb, 1977). It has now been
shown (Grootes et al. , 1993) that the correlation in the two parallel 6 18 0
series from Summit, despite good agreement on the millennial timescale, is
very poor over the last 10,000 years. Whether this is the result of a lack
of absolute (i.e. demonstrably annual) dating control in the two cores, or
an indication of a very poor level of common forcing (which must imply a
high degree of noise in one, or both, series), is not yet clear. However, such
information is extremely valuable in warning that previous interpretation of
single core data, in terms of detailed temperature information over re cent
centuries, must now be considered to be at least potentially suspect.
Despite the logistic and financial constraints, it is to be hoped that investigations of other proxy sources, such as lake varves and corals, will also
address the need to produce replicate data series.
SSS = EPS(t')
EPS(t)
83
(5.3)
SSS (like EP S) ranges from zero to 1.0 and, again, the question of an acceptable level is somewhat subjective. In the context of climate reconstruction,
it is desirable to maintain SSS at a level weIl above the level of variance
explained by climate calibration (see later). This quest ion is discussed in
Wigleyet al. (1984) and Briffa and Jones (1990).
It should be noted that RBAR (and consequently EPS and SSS) are
generally considered as single parameters representative of a chronology as
a whole. RBAR is an unbiased estimator of the population parameter and
will give an accurate estimate provided it is calculated using data for at
least 5-10 series (Briffa, 1984). However, when calculated for a moving time
window, noticeable variations can occur. Provided these are based on reasonable sampie sizes (say a minimumof 30-50 years), they may represent genuine
temporal variability in the strength of common forcing and this should be
recognised when considering a single, overall chronology value (Briffa et al.,
1987; Briffa and Jones, 1990).
5.4.4 Wider Relevance of Chronology Signal
The concept of a replicated signal, and the requirement to quantify the degree
to which such signals are contaminated with noise in constructed time series
obviously has relevance for all proxy data. This is dramatically illustrated
by the re cent discussion of oxygen isotope data from closely adjacent (within
30 km) cores on the summit of the Greenland ice sheet (e.g. Dansgaard
et al. , 1993; Taylor et al. , 1992). For many years, similar "high-resolution"
data from another Greenland core (e.g. Dansgaard et al. , 1975) were interpreted as evidence of decadal-to-century variability in annual temperature
and strongly influenced our perception of the climate history of the northern
North Atlantic during recent millennia (e.g. Lamb, 1977). It has now been
shown (Grootes et al. , 1993) that the correlation in the two parallel 6 18 0
series from Summit, despite good agreement on the millennial timescale, is
very poor over the last 10,000 years. Whether this is the result of a lack
of absolute (i.e. demonstrably annual) dating control in the two cores, or
an indication of a very poor level of common forcing (which must imply a
high degree of noise in one, or both, series), is not yet clear. However, such
information is extremely valuable in warning that previous interpretation of
single core data, in terms of detailed temperature information over re cent
centuries, must now be considered to be at least potentially suspect.
Despite the logistic and financial constraints, it is to be hoped that investigations of other proxy sources, such as lake varves and corals, will also
address the need to produce replicate data series.