

Seetion 5.4: Chronology Confidence
81
Jones, 1990).
For relatively high-frequency data, RBAR is unbiased and provides an
accurate measure of chronology signal, but for low-frequency (i.e. long
timescale) variability it is a poor measure (i.e. it has wide confidence limits)
dependent on the series autocorrelation. For low-frequency data, multiple
sub-sample replication (Le. bootstrapping; Efron, 1979) can provide an alternative measure of chronology confidence (e.g. Guiot, 1990; Cook, 1990).
RBAR for a group of trees could, in theory, range from -1.0 to 1.0, though,
in practise, only positive values are meaningful (negative values indicating a
complete lack of common growth forcing). The higher the value, the stronger
is the underlying common signal; then the less variance within each series
represents noise and fewer series need to be averaged to reduce the noise
remaining in the final mean chronology to an "acceptable" level (see later).
5.4.2 Expressed Population Signal
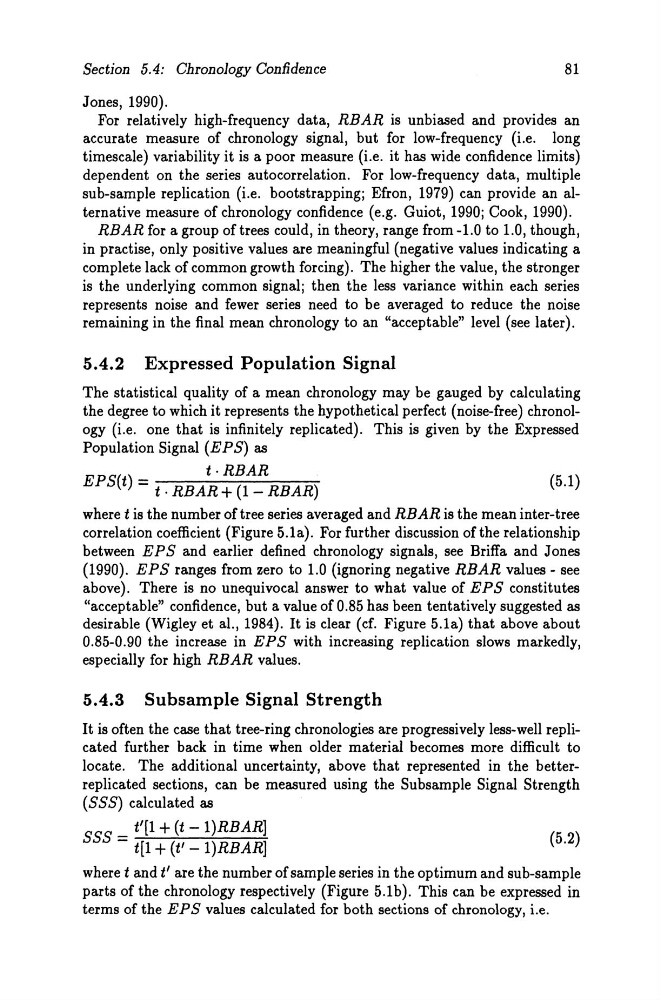
The statistical quality of a mean chronology may be gauged by calculating
the degree to which it represents the hypothetical perfect (noise-free) chronology (Le. one that is infinitely replicated). This is given by the Expressed
Population Signal (EPS) as
t·RBAR
EPS(t) = t. RBAR+ (1- RBAR)
(5.1)
where t is the number oftree series averaged and RBAR is the mean inter-tree
correlation coefficient (Figure 5.1a). For further discussion ofthe relationship
between E P Sand earlier defined chronology signals, see Briffa and J ones
(1990). EPS ranges from zero to 1.0 (ignoring negative RBAR values - see
above). There is no unequivocal answer to what value of EPS constitutes
"acceptable" confidence, but a value of 0.85 has been tentatively suggested as
desirable (Wigley et al., 1984). It is dear (cf. Figure 5.1a) that above ab out
0.85-0.90 the increase in EPS with increasing replication slows markedly,
especially for high RB AR values.
5.4.3 SubsampIe Signal Strength
It is often the case that tree-ring chronologies are progressively less-well replicated further back in time when older material becomes more difficult to
locate. The additional uncertainty, above that represented in the betterreplicated sections, can be measured using the SubsampIe Signal Strength
(SSS) calculated as
SSS = t'[1 + (t - 1)RBAR]
(5.2)
t[1 + (t' - 1)RBAR]
where t and t' are the number of sampIe series in the optimum and sub-sam pIe
parts of the chronology respectively (Figure 5.1b). This can be expressed in
terms of the EPS values calculated for both sections of chronology, i.e.
81
Jones, 1990).
For relatively high-frequency data, RBAR is unbiased and provides an
accurate measure of chronology signal, but for low-frequency (i.e. long
timescale) variability it is a poor measure (i.e. it has wide confidence limits)
dependent on the series autocorrelation. For low-frequency data, multiple
sub-sample replication (Le. bootstrapping; Efron, 1979) can provide an alternative measure of chronology confidence (e.g. Guiot, 1990; Cook, 1990).
RBAR for a group of trees could, in theory, range from -1.0 to 1.0, though,
in practise, only positive values are meaningful (negative values indicating a
complete lack of common growth forcing). The higher the value, the stronger
is the underlying common signal; then the less variance within each series
represents noise and fewer series need to be averaged to reduce the noise
remaining in the final mean chronology to an "acceptable" level (see later).
5.4.2 Expressed Population Signal
The statistical quality of a mean chronology may be gauged by calculating
the degree to which it represents the hypothetical perfect (noise-free) chronology (Le. one that is infinitely replicated). This is given by the Expressed
Population Signal (EPS) as
t·RBAR
EPS(t) = t. RBAR+ (1- RBAR)
(5.1)
where t is the number oftree series averaged and RBAR is the mean inter-tree
correlation coefficient (Figure 5.1a). For further discussion ofthe relationship
between E P Sand earlier defined chronology signals, see Briffa and J ones
(1990). EPS ranges from zero to 1.0 (ignoring negative RBAR values - see
above). There is no unequivocal answer to what value of EPS constitutes
"acceptable" confidence, but a value of 0.85 has been tentatively suggested as
desirable (Wigley et al., 1984). It is dear (cf. Figure 5.1a) that above ab out
0.85-0.90 the increase in EPS with increasing replication slows markedly,
especially for high RB AR values.
5.4.3 SubsampIe Signal Strength
It is often the case that tree-ring chronologies are progressively less-well replicated further back in time when older material becomes more difficult to
locate. The additional uncertainty, above that represented in the betterreplicated sections, can be measured using the SubsampIe Signal Strength
(SSS) calculated as
SSS = t'[1 + (t - 1)RBAR]
(5.2)
t[1 + (t' - 1)RBAR]
where t and t' are the number of sampIe series in the optimum and sub-sam pIe
parts of the chronology respectively (Figure 5.1b). This can be expressed in
terms of the EPS values calculated for both sections of chronology, i.e.