

70
Ghapter 4: The Instrumental Data Record
observed me an fields of change relative to 1900-09 for the overlapping decades
from 1910-19 to 1980-89.
If the enhanced greenhouse effect is actually becoming stronger in the observed data, and if the model-based estimate of the signal is reasonable,
M(x) and D(x, t) should become increasingly similar - i.e., there should be
a positive trend in the statistic used to measure similarity. Detection then
becomes a problem of identifying a significant trend in the similarity statistic.
The next choice, therefore, is to select an appropriate indicator of pattern
similarity. In the past, some inappropriate choices have been made.
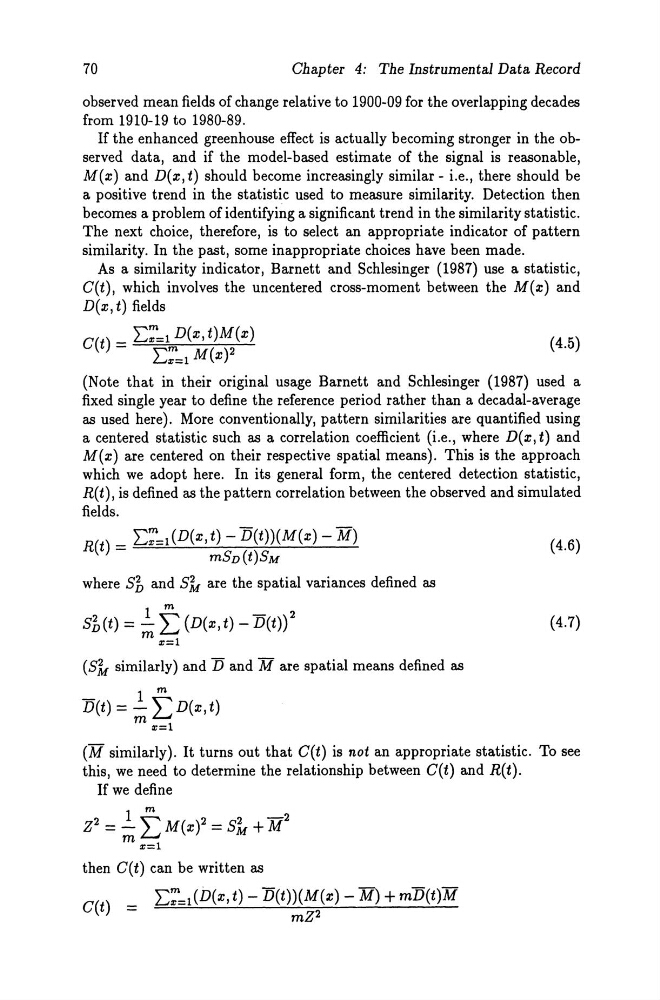
As a similarity indicator, Barnett and Schlesinger (1987) use a statistic,
G(t), which involves the uncentered cross-moment between the M(x) and
D(x, t) fields
G( ) _ l:~-1 D(x, t)M(x)
t -
"m ()2
L....-x=l Mx
(4.5)
(Note that in their original usage Barnett and Schlesinger (1987) used a
fixed single year to define the reference period rather than a decadal-average
as used here). More conventionally, pattern similarities are quantified using
a centered statistic such as a correlation coefficient (i.e., where D(x, t) and
M(x) are centered on their respective spatial means). This is the approach
which we adopt here. In its general form, the centered detection statistic,
R(t), is defined as the pattern correlation between the observed and simulated
fields.
R(t) = l:~l(D(x, t) - D(t»(M(x) - XI)
(4.6)
mSD(t)SM
where S1 and S1- are the spatial variances defined as
s1(t) = ! t (D(x, t) - D(t»)2
m x=l
(S1- similarly) and D and Mare spatial means defined as
1 m
D(t) = - L D(x, t)
m x=l
(4.7)
(M similarly). It turns out that G(t) is not an appropriate statistic. To see
this, we need to determine the relationship between G(t) and R(t).
If we define
Z2 = ~ fM(x)2 = slt +M 2
m x=l
then G(t) can be written as
G(t) = l:~=1 (D(x, t) - D(t»(M(x) - XI) + mD(t)M
mZ 2
Ghapter 4: The Instrumental Data Record
observed me an fields of change relative to 1900-09 for the overlapping decades
from 1910-19 to 1980-89.
If the enhanced greenhouse effect is actually becoming stronger in the observed data, and if the model-based estimate of the signal is reasonable,
M(x) and D(x, t) should become increasingly similar - i.e., there should be
a positive trend in the statistic used to measure similarity. Detection then
becomes a problem of identifying a significant trend in the similarity statistic.
The next choice, therefore, is to select an appropriate indicator of pattern
similarity. In the past, some inappropriate choices have been made.
As a similarity indicator, Barnett and Schlesinger (1987) use a statistic,
G(t), which involves the uncentered cross-moment between the M(x) and
D(x, t) fields
G( ) _ l:~-1 D(x, t)M(x)
t -
"m ()2
L....-x=l Mx
(4.5)
(Note that in their original usage Barnett and Schlesinger (1987) used a
fixed single year to define the reference period rather than a decadal-average
as used here). More conventionally, pattern similarities are quantified using
a centered statistic such as a correlation coefficient (i.e., where D(x, t) and
M(x) are centered on their respective spatial means). This is the approach
which we adopt here. In its general form, the centered detection statistic,
R(t), is defined as the pattern correlation between the observed and simulated
fields.
R(t) = l:~l(D(x, t) - D(t»(M(x) - XI)
(4.6)
mSD(t)SM
where S1 and S1- are the spatial variances defined as
s1(t) = ! t (D(x, t) - D(t»)2
m x=l
(S1- similarly) and D and Mare spatial means defined as
1 m
D(t) = - L D(x, t)
m x=l
(4.7)
(M similarly). It turns out that G(t) is not an appropriate statistic. To see
this, we need to determine the relationship between G(t) and R(t).
If we define
Z2 = ~ fM(x)2 = slt +M 2
m x=l
then G(t) can be written as
G(t) = l:~=1 (D(x, t) - D(t»(M(x) - XI) + mD(t)M
mZ 2