

68
Chapter 4: The Instrumental Data Record
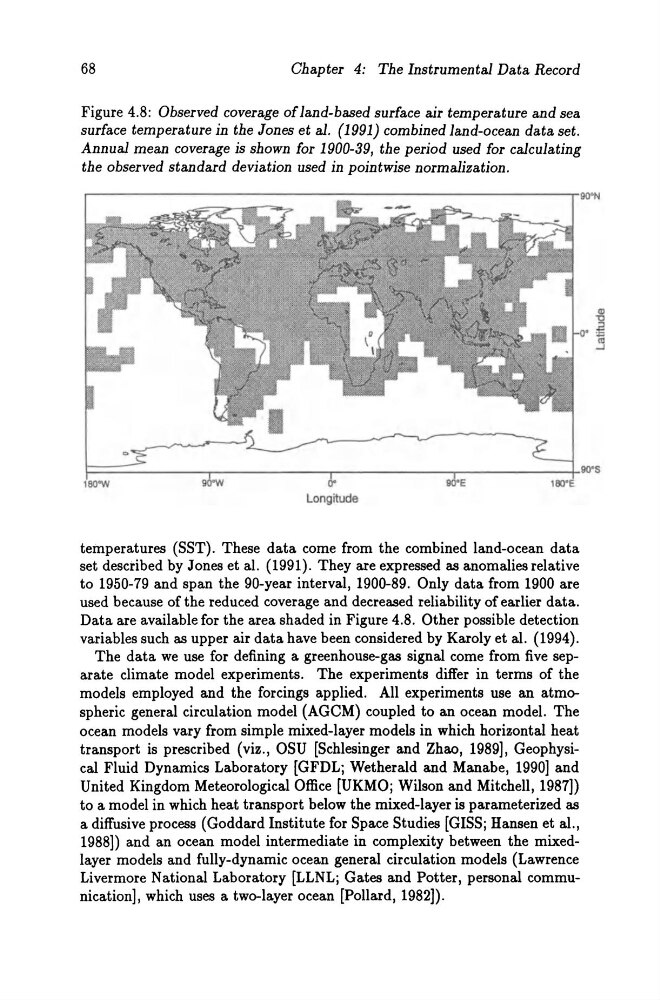
Figure 4.8: Observed coverage of land-based surface rur temperature and sea
surface temperature in the Jones et al. (1991) combined land-ocean da ta set.
Annual mean coverage is shown for 1900-39, the period used for calculating
the observed standard deviation used in pointwise normalization.
Longitude
temperatures (SST). These data come from the combined land-ocean data
set described by Jones et al. (1991). They are expressed as anomalies relative
to 1950-79 and span the 90-year interval, 1900-89. Only data from 1900 are
used because of the reduced coverage and decreased reliability of earlier data.
Data are available for the area shaded in Figure 4.8. Other possible detection
variables such as upper air data have been considered by Karoly et al. (1994).
The data we use for defining a greenhouse-gas signal come from five separate climate model experiments. The experiments differ in terms of the
models employed and the forcings applied. All experiments use an atmospheric general circulation model (AGCM) coupled to an ocean model. The
ocean models vary from simple mixed-Iayer models in which horizontal heat
transport is prescribed (viz., OSU [Schlesinger and Zhao, 1989], Geophysical Fluid Dynamics Laboratory [GFDL; Wetherald and Manabe, 1990] and
United Kingdom Meteorological Office [UKMO; Wilson and Mitchell, 1987])
to a model in which heat transport below the mixed-Iayer is parameterized as
a diffusive process (Goddard Institute for Space Studies [GISS; Hansen et al.,
1988]) and an ocean model intermediate in complexity between the mixedlayer models and fully-dynamic ocean general circulation models (Lawrence
Livermore National Laboratory [LLNL; Gates and Potter, personal communication], which uses a two-Iayer ocean [Pollard, 1982]).
Chapter 4: The Instrumental Data Record
Figure 4.8: Observed coverage of land-based surface rur temperature and sea
surface temperature in the Jones et al. (1991) combined land-ocean da ta set.
Annual mean coverage is shown for 1900-39, the period used for calculating
the observed standard deviation used in pointwise normalization.
Longitude
temperatures (SST). These data come from the combined land-ocean data
set described by Jones et al. (1991). They are expressed as anomalies relative
to 1950-79 and span the 90-year interval, 1900-89. Only data from 1900 are
used because of the reduced coverage and decreased reliability of earlier data.
Data are available for the area shaded in Figure 4.8. Other possible detection
variables such as upper air data have been considered by Karoly et al. (1994).
The data we use for defining a greenhouse-gas signal come from five separate climate model experiments. The experiments differ in terms of the
models employed and the forcings applied. All experiments use an atmospheric general circulation model (AGCM) coupled to an ocean model. The
ocean models vary from simple mixed-Iayer models in which horizontal heat
transport is prescribed (viz., OSU [Schlesinger and Zhao, 1989], Geophysical Fluid Dynamics Laboratory [GFDL; Wetherald and Manabe, 1990] and
United Kingdom Meteorological Office [UKMO; Wilson and Mitchell, 1987])
to a model in which heat transport below the mixed-Iayer is parameterized as
a diffusive process (Goddard Institute for Space Studies [GISS; Hansen et al.,
1988]) and an ocean model intermediate in complexity between the mixedlayer models and fully-dynamic ocean general circulation models (Lawrence
Livermore National Laboratory [LLNL; Gates and Potter, personal communication], which uses a two-Iayer ocean [Pollard, 1982]).