

66
Chapter 4: The Instrumental Data Record
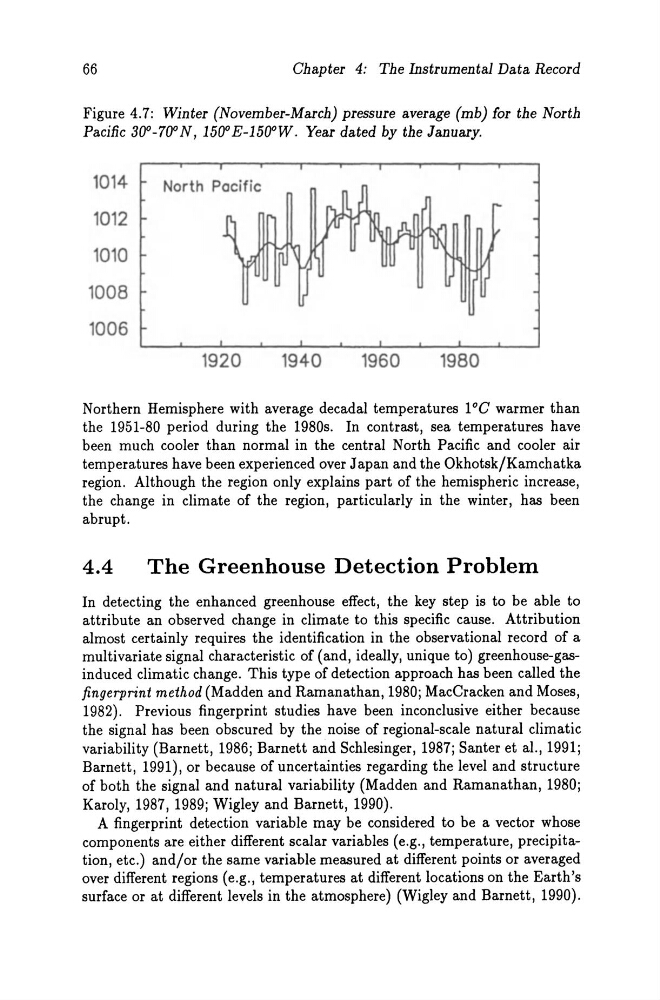
Figure 4.7: Winter (November-March) press ure average (mb) for the North
Pacific 300-700 N, 1500 E-15OOW. Year dated by the January.
1014
North Pacific
1012
1010
1008
1006
1920
1940
1960
1980
Northern Hemisphere with average decadal temperatures 1°C warmer than
the 1951-80 period during the 1980s. In contrast, sea temperatures have
been much cooler than normal in the central North Pacific and cooler air
temperatures have been experienced over Japan and the Okhotsk/Kamchatka
region. Although the region only explains part of the hemispheric increase,
the change in climate of the region, particularly in the winter, has been
abrupt.
4.4
The Greenhouse Detection Problem
In detecting the enhanced greenhouse effect, the key step is to be able to
attribute an observed change in climate to this specific cause. Attribution
almost certainly requires the identification in the observational record of a
multivariate signal characteristic of (and, ideally, unique to) greenhouse-gasinduced climatic change. This type of detection approach has been called the
fingerprint method (Madden and Ramanathan, 1980; MacCracken and Moses,
1982). Previous fingerprint studies have been inconclusive either because
the signal has been obscured by the noise of regional-scale natural climatic
variability (Barnett, 1986; Barnett and Schlesinger, 1987; Santer et al., 1991;
Barnett, 1991), or because of uncertainties regarding the level and structure
of both the signal and natural variability (Madden and Ramanathan, 1980;
Karoly, 1987, 1989; Wigley and Barnett, 1990).
A fingerprint detection variable may be considered to be a vector whose
components are either different scalar variables (e.g., temperature, precipitation, etc.) and/or the same variable measured at different points or averaged
over different regions (e.g., temperatures at different locations on the Earth's
surface or at different levels in the atmosphere) (Wigley and Barnett, 1990).
Chapter 4: The Instrumental Data Record
Figure 4.7: Winter (November-March) press ure average (mb) for the North
Pacific 300-700 N, 1500 E-15OOW. Year dated by the January.
1014
North Pacific
1012
1010
1008
1006
1920
1940
1960
1980
Northern Hemisphere with average decadal temperatures 1°C warmer than
the 1951-80 period during the 1980s. In contrast, sea temperatures have
been much cooler than normal in the central North Pacific and cooler air
temperatures have been experienced over Japan and the Okhotsk/Kamchatka
region. Although the region only explains part of the hemispheric increase,
the change in climate of the region, particularly in the winter, has been
abrupt.
4.4
The Greenhouse Detection Problem
In detecting the enhanced greenhouse effect, the key step is to be able to
attribute an observed change in climate to this specific cause. Attribution
almost certainly requires the identification in the observational record of a
multivariate signal characteristic of (and, ideally, unique to) greenhouse-gasinduced climatic change. This type of detection approach has been called the
fingerprint method (Madden and Ramanathan, 1980; MacCracken and Moses,
1982). Previous fingerprint studies have been inconclusive either because
the signal has been obscured by the noise of regional-scale natural climatic
variability (Barnett, 1986; Barnett and Schlesinger, 1987; Santer et al., 1991;
Barnett, 1991), or because of uncertainties regarding the level and structure
of both the signal and natural variability (Madden and Ramanathan, 1980;
Karoly, 1987, 1989; Wigley and Barnett, 1990).
A fingerprint detection variable may be considered to be a vector whose
components are either different scalar variables (e.g., temperature, precipitation, etc.) and/or the same variable measured at different points or averaged
over different regions (e.g., temperatures at different locations on the Earth's
surface or at different levels in the atmosphere) (Wigley and Barnett, 1990).