

Section 4.3: Surface Climate Analysis
61
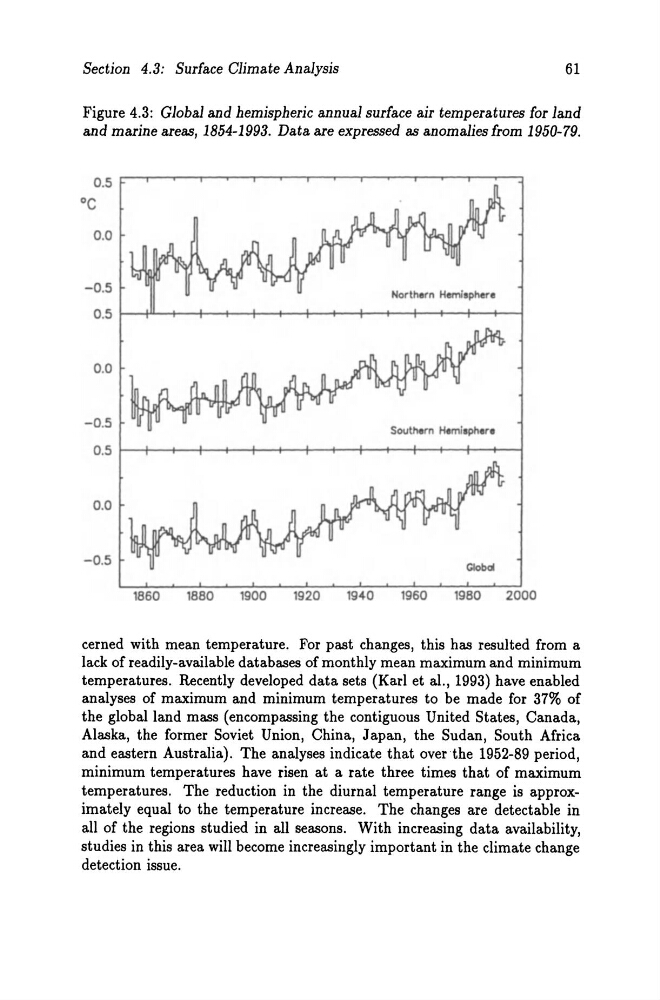
Figure 4.3: Global and hemispheric annual surface a.ir temperatures for land
and marine areas, 1854-1993. Data are expressed as anomalies from 1950-79.
0.5
oe
0.0
-0.5
Norlhern Hemllp/Ier.
0.5 1---f.II.--t--f--+--+--t--I---+--f--+--+-+--+--t---t
0.0
-0.5
Southern Hcmilph.,.
0.5 ....... -t--t--!---+--+---II---+---+----il---+--+---I--t--t--;
0.0
-0.5
1860
1880
1900
1920
1940
1960
1980
2000
cerned with mean temperature. For past changes, this has resulted from a
lack of readily-available databases of monthly mean maximum and minimum
temperatures. Recently developed data sets (Karl et al., 1993) have enabled
analyses of maximum and minimum temperatures to be made for 37% of
the global land mass (encompassing the contiguous United States, Canada,
Alaska, the former Soviet Union, China, Japan, the Sudan, South Africa
and eastern Australia) . The analyses indicate that over the 1952-89 period,
minimum temperatures have risen at a rate three times that of maximum
temperatures. The reduction in the diurnal temperature range is approximately equal to the temperature increase. The changes are detectable in
all of the regions studied in all seasons. With increasing data availability,
studies in this area will become increasingly important in the climate change
detection issue.
61
Figure 4.3: Global and hemispheric annual surface a.ir temperatures for land
and marine areas, 1854-1993. Data are expressed as anomalies from 1950-79.
0.5
oe
0.0
-0.5
Norlhern Hemllp/Ier.
0.5 1---f.II.--t--f--+--+--t--I---+--f--+--+-+--+--t---t
0.0
-0.5
Southern Hcmilph.,.
0.5 ....... -t--t--!---+--+---II---+---+----il---+--+---I--t--t--;
0.0
-0.5
1860
1880
1900
1920
1940
1960
1980
2000
cerned with mean temperature. For past changes, this has resulted from a
lack of readily-available databases of monthly mean maximum and minimum
temperatures. Recently developed data sets (Karl et al., 1993) have enabled
analyses of maximum and minimum temperatures to be made for 37% of
the global land mass (encompassing the contiguous United States, Canada,
Alaska, the former Soviet Union, China, Japan, the Sudan, South Africa
and eastern Australia) . The analyses indicate that over the 1952-89 period,
minimum temperatures have risen at a rate three times that of maximum
temperatures. The reduction in the diurnal temperature range is approximately equal to the temperature increase. The changes are detectable in
all of the regions studied in all seasons. With increasing data availability,
studies in this area will become increasingly important in the climate change
detection issue.