

Section 14.4: Climatic Applications of SSA
277
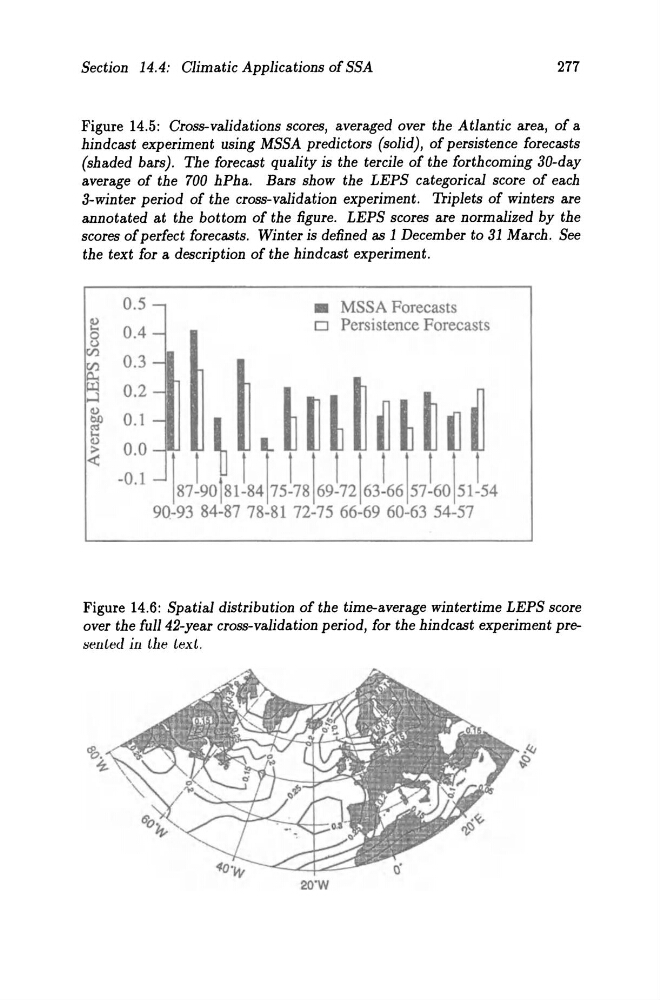
Figure 14.5: Cross-validations scores, averaged over the Atlantic area, of a
hindcast experiment using MSSA predictors (solid), of persistence forecasts
(shaded bars). The forecast quality is the tercile of the forthcoming 30-day
average of the 700 hPha. Bars show the LEPS categorical score of each
3-winter period of the cross-validation experiment. Triplets of winters are
annotated at the bot tom of the figure. LEPS scores are normalized by the
scores of perfect forecasts. Winter is defined as 1 December to 31 March. See
the text for a description of the hindcast experiment.
0.5
0.4
0.3
0.2
0.1
0.0
-0.1
• MSSA Forecasts
o Persistence Forecasts
Figure 14.6: Spatial distribution of the time-average wintertime LEPS score
over the fu1l42-year cross-validation period, for the hindcast experiment prel:IeIlted iIl the text.
20'W
277
Figure 14.5: Cross-validations scores, averaged over the Atlantic area, of a
hindcast experiment using MSSA predictors (solid), of persistence forecasts
(shaded bars). The forecast quality is the tercile of the forthcoming 30-day
average of the 700 hPha. Bars show the LEPS categorical score of each
3-winter period of the cross-validation experiment. Triplets of winters are
annotated at the bot tom of the figure. LEPS scores are normalized by the
scores of perfect forecasts. Winter is defined as 1 December to 31 March. See
the text for a description of the hindcast experiment.
0.5
0.4
0.3
0.2
0.1
0.0
-0.1
• MSSA Forecasts
o Persistence Forecasts
Figure 14.6: Spatial distribution of the time-average wintertime LEPS score
over the fu1l42-year cross-validation period, for the hindcast experiment prel:IeIlted iIl the text.
20'W