

274
Chapter 14: Patterns in Time: SSA and MSSA
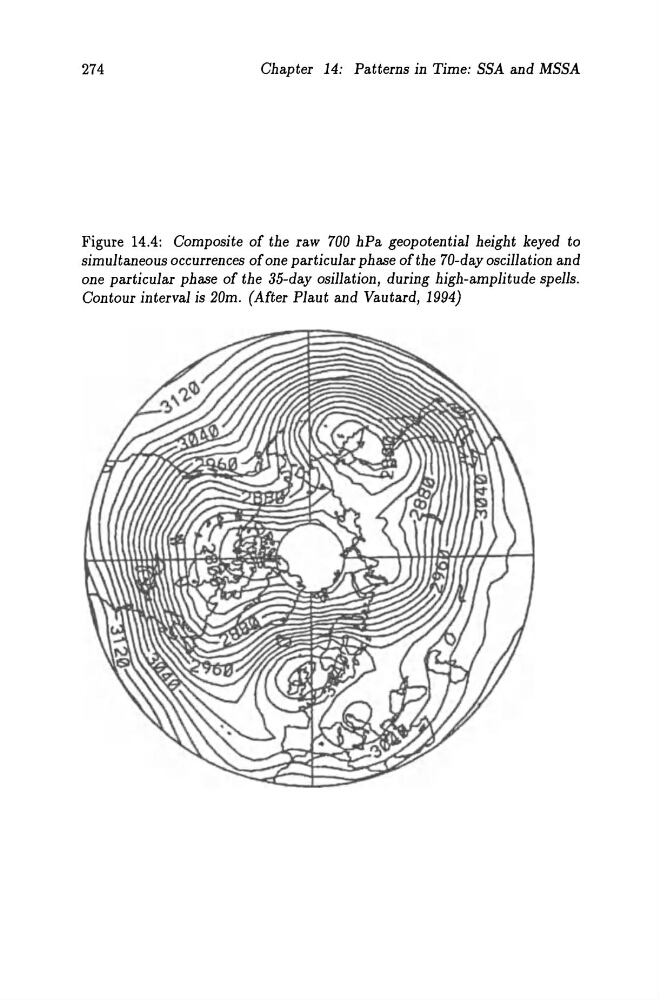
Figure 14.4: Composite of the raw 700 hPa geopotential height keyed to
simuItaneous occurrences of one particular phase of the 70-day oscillation and
one particular phase of the 35-day osillation, during high-amplitude spells.
Contour interval is 20m. (After Plaut and Vautard, 1994)
Chapter 14: Patterns in Time: SSA and MSSA
Figure 14.4: Composite of the raw 700 hPa geopotential height keyed to
simuItaneous occurrences of one particular phase of the 70-day oscillation and
one particular phase of the 35-day osillation, during high-amplitude spells.
Contour interval is 20m. (After Plaut and Vautard, 1994)