

272
Chapter 14: Patterns in Time: SSA and MSSA
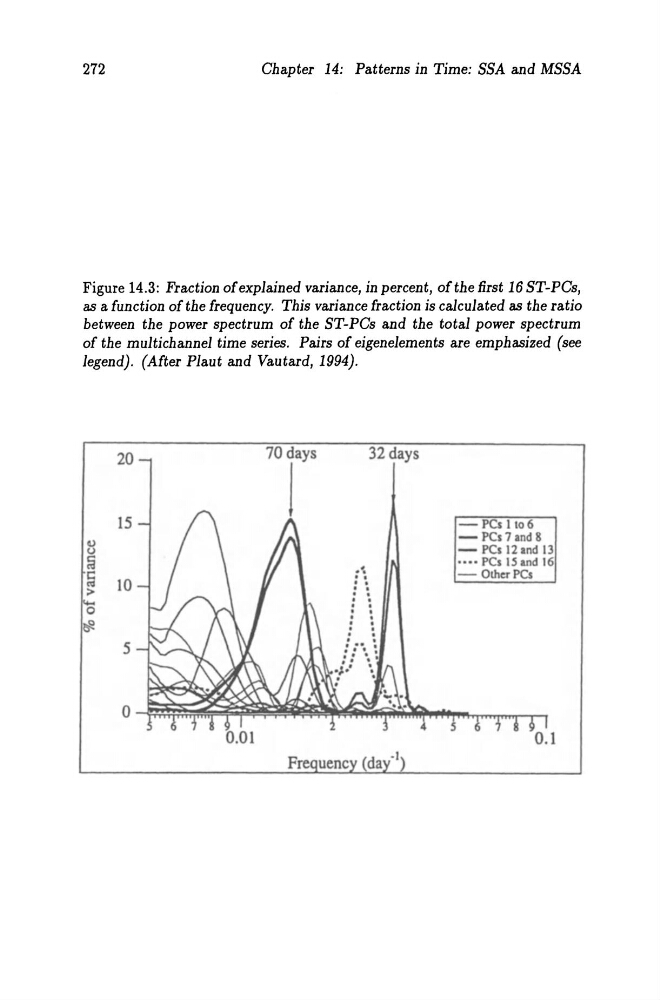
Figure 14.3: Fraction ofexplained variance, in percent, ofthe first 16 ST-PCs,
as a function ofthe frequency. This variance fraction is calculated as the ratio
between the power spectrum of the ST-PCs and the total power spectrum
of the multichannel time series. Pairs of eigenelements are emphasized (see
legend). (After Plaut and Vautard, 1994).
20
32 days
15
-PCslto6
u
-PCs7and8
u
-
PCs 12 .nd 13
~
•••• PCs 15 and 16
t:
10
- OtherPCs
0
~
5
0.01
0.1
Chapter 14: Patterns in Time: SSA and MSSA
Figure 14.3: Fraction ofexplained variance, in percent, ofthe first 16 ST-PCs,
as a function ofthe frequency. This variance fraction is calculated as the ratio
between the power spectrum of the ST-PCs and the total power spectrum
of the multichannel time series. Pairs of eigenelements are emphasized (see
legend). (After Plaut and Vautard, 1994).
20
32 days
15
-PCslto6
u
-PCs7and8
u
-
PCs 12 .nd 13
~
•••• PCs 15 and 16
t:
10
- OtherPCs
0
~
5
0.01
0.1