

246
Ghapter 13: Spatial Patterns: EOFs and GGA
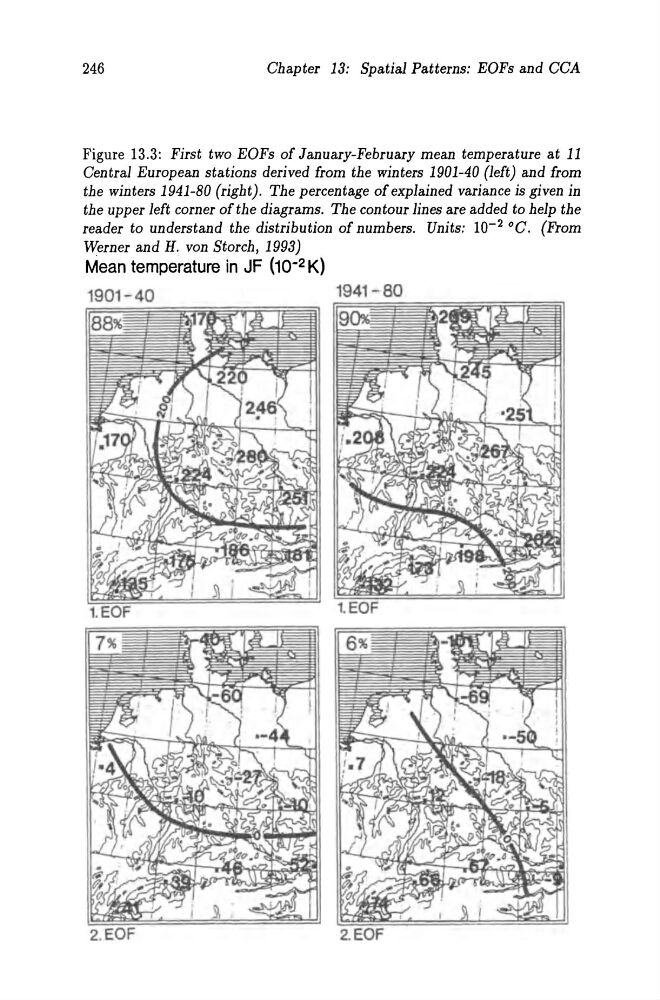
Figure 13.3: First two EOFs of January-February mean temperature at 11
Central European stations derived from the winters 1901-40 (Jeft) and from
the winters 1941-80 (right). The percentage of explained variance is given in
the upper left corner of the diagrams. The contour lines are added to help the
reader to understand the distribution of numbers. Units: 10- 2 °G. (From
Werner and H. von Storch, 1993)
Mean temperature in JF (10- 2 K)
1901- 40
1941 - 80 = = =
l.EOF
Ghapter 13: Spatial Patterns: EOFs and GGA
Figure 13.3: First two EOFs of January-February mean temperature at 11
Central European stations derived from the winters 1901-40 (Jeft) and from
the winters 1941-80 (right). The percentage of explained variance is given in
the upper left corner of the diagrams. The contour lines are added to help the
reader to understand the distribution of numbers. Units: 10- 2 °G. (From
Werner and H. von Storch, 1993)
Mean temperature in JF (10- 2 K)
1901- 40
1941 - 80 = = =
l.EOF