

Section 12.4: Concluding Remarks
225
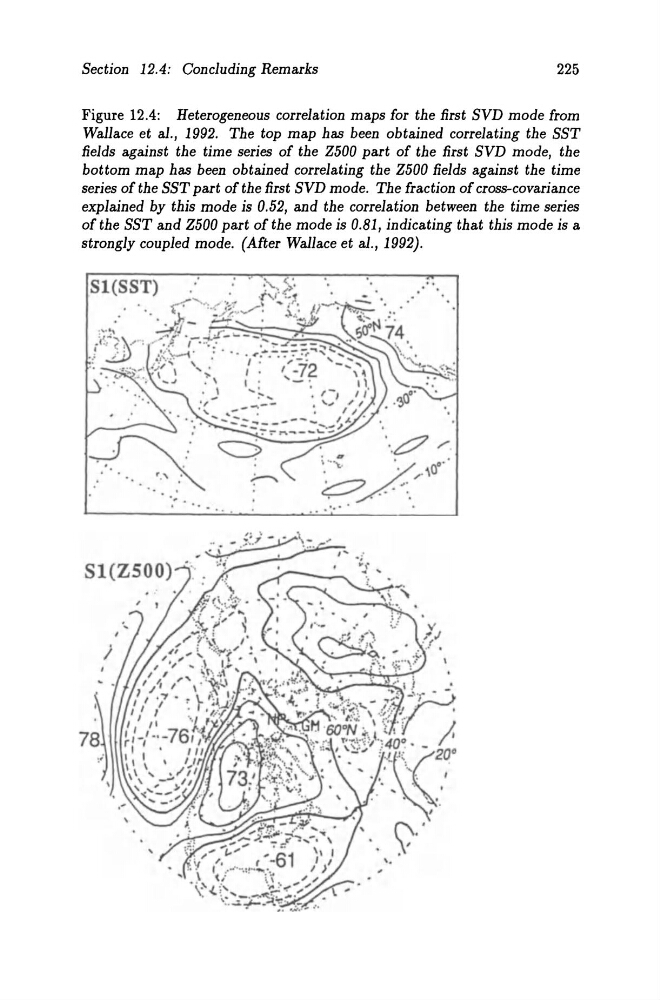
Figure 12.4: Heterogeneous correlation maps for the first SVD mode from
Wallace et al., 1992. The top map has been obtained correlating the SST
fields against the time series of the Z500 part of the first SVD mode, the
bottom map has been obtained correlating the Z500 fields against the time
series of the SST part of the first SVD mode. The fraction of cross-covariance
explained by this mode is 0.52, and the correlation between the time series
of the SST and Z500 part of the mode is 0.81, indicating that this mode is a
strongly coupled mode. (After Wallace et al., 1992).
~
.
.
.
. .. ,., .
. .
.
.
" ...
"
7~
\
, . .
v
225
Figure 12.4: Heterogeneous correlation maps for the first SVD mode from
Wallace et al., 1992. The top map has been obtained correlating the SST
fields against the time series of the Z500 part of the first SVD mode, the
bottom map has been obtained correlating the Z500 fields against the time
series of the SST part of the first SVD mode. The fraction of cross-covariance
explained by this mode is 0.52, and the correlation between the time series
of the SST and Z500 part of the mode is 0.81, indicating that this mode is a
strongly coupled mode. (After Wallace et al., 1992).
~
.
.
.
. .. ,., .
. .
.
.
" ...
"
7~
\
, . .
v