

218
Chapter 12: Teleconnections Patterns
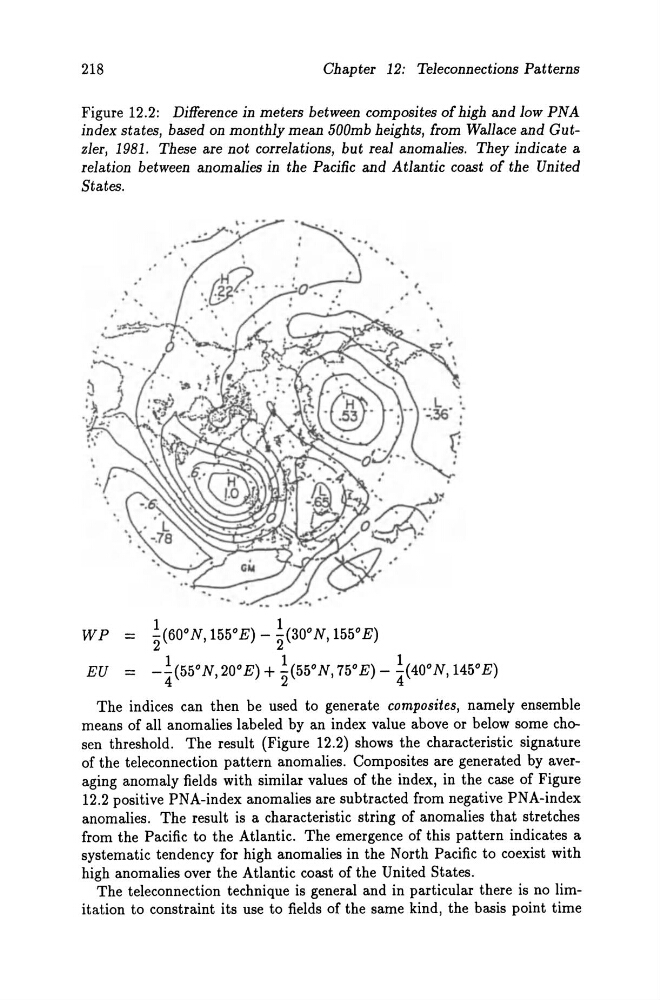
Figure 12.2: Difference in meters between composites of high and low PNA
index states, based on monthly mean 500mb heights, from Wallace and GutzIer, 1981. These are not correlations, but real anomalies. They indicate a
relation between anomalies in the Pacific and Atlantic coast of the Uni ted
States.
,
. ,
~
'
'.
. .
. . .
. '.
.
.
.
.
.
.
,
.
.
" "0 '. •
. '.
,
.
w P
~(60° N, 155 0 E) - ~(30° N, 155 0 E)
. .
EU
-1(55 0 N, 20 0 E) + ~(55° N, 75 0 E) -1(40 0 N, 145 0 E)
The indices can then be used to generate composites, namely ensemble
means of all anomalies labeled by an index value above or below some chosen threshold. The result (Figure 12.2) shows the characteristic signature
of the teleconnection pattern anomalies. Composites are generated by averaging anomaly fields with similar values of the index, in the case of Figure
12.2 positive PNA-index anomalies are subtracted from negative PNA-index
anomalies. The result is a characteristic string of anomalies that stretches
from the Pacific to the Atlantic. The emergence of this pattern indicates a
systematic tendency for high anomalies in the North Pacific to coexist with
high anomalies over the Atlantic coast of the United States.
The teleconnection technique is general and in particular there is no limitation to constraint its use to fields of the same kind, the basis point time
Chapter 12: Teleconnections Patterns
Figure 12.2: Difference in meters between composites of high and low PNA
index states, based on monthly mean 500mb heights, from Wallace and GutzIer, 1981. These are not correlations, but real anomalies. They indicate a
relation between anomalies in the Pacific and Atlantic coast of the Uni ted
States.
,
. ,
~
'
'.
. .
. . .
. '.
.
.
.
.
.
.
,
.
.
" "0 '. •
. '.
,
.
w P
~(60° N, 155 0 E) - ~(30° N, 155 0 E)
. .
EU
-1(55 0 N, 20 0 E) + ~(55° N, 75 0 E) -1(40 0 N, 145 0 E)
The indices can then be used to generate composites, namely ensemble
means of all anomalies labeled by an index value above or below some chosen threshold. The result (Figure 12.2) shows the characteristic signature
of the teleconnection pattern anomalies. Composites are generated by averaging anomaly fields with similar values of the index, in the case of Figure
12.2 positive PNA-index anomalies are subtracted from negative PNA-index
anomalies. The result is a characteristic string of anomalies that stretches
from the Pacific to the Atlantic. The emergence of this pattern indicates a
systematic tendency for high anomalies in the North Pacific to coexist with
high anomalies over the Atlantic coast of the United States.
The teleconnection technique is general and in particular there is no limitation to constraint its use to fields of the same kind, the basis point time