

Section 11.2: Probabilistic Characteristics
199
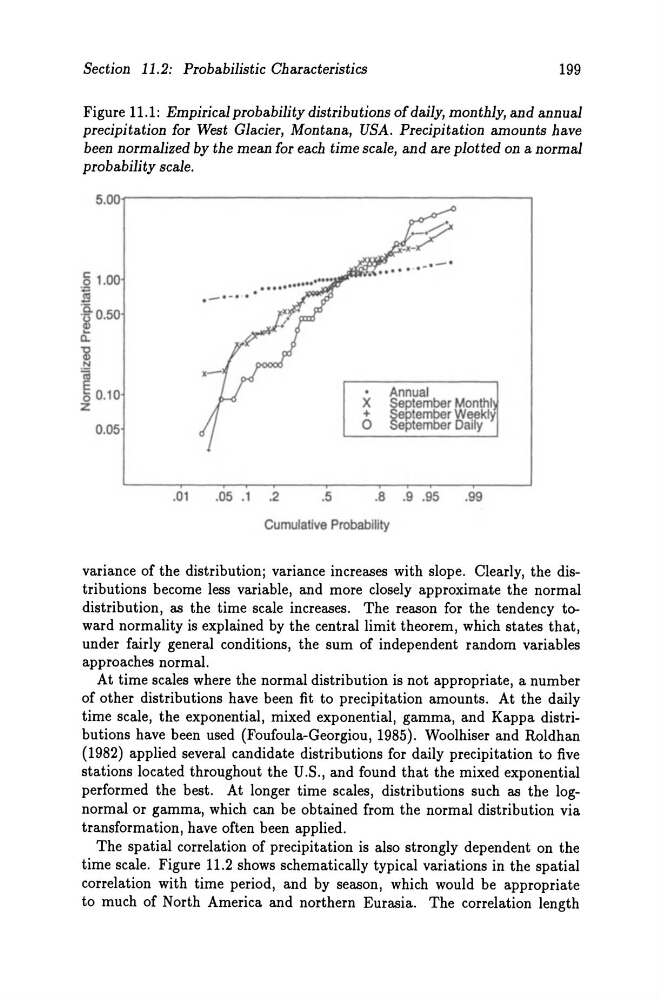
Figure 11.1: Empirical probability distributions of daily, monthly, and annual
precipitation for West Glacier, Montana, USA. Precipitation amounts have
been normalized by the mean for each time scale, and are plot ted on anormal
probability scale.
5.00~---------------------------------------------'
61.00
....
J!I
'0..
'2 0 . 50
'Q.
i
~ 0 0.10
z
0.05
.01
. -
• .o • •
.05.1 .2
.5
.- '
•
Annual
X ~eglember Monthl
0 +
e lernber Weekly
e lernber Daily
.8 .9 .95
.99
Cumulatlve Probablllly
variance of the distribution; variance increases with slope. Clearly, the distributions become less variable, and more closely approximate the normal
distribution, as the time scale increases. The reason for the tendency toward normality is explained by the central limit theorem, which states that,
under fairly general conditions, the sum of independent random variables
approaches normal.
At time scales where the normal distribution is not appropriate, a number
of other distributions have been fit to precipitation amounts. At the daily
time scale, the exponential, mixed exponential, gamma, and Kappa distributions have been used (Foufoula-Georgiou, 1985). Woolhiser and Roldhan
(1982) applied several candidate distributions for daily precipitation to five
stations located throughout the U.S., and found that the mixed exponential
performed the best. At longer time scales, distributions such as the lognormal or gamma, which can be obtained from the normal distribution via
transformation, have often been applied.
The spatial correlation of precipitation is also strongly dependent on the
time scale. Figure 11.2 shows schematically typical variations in the spatial
correlation with time period, and by season, which would be appropriate
to much of North America and northern Eurasia. The correlation length
199
Figure 11.1: Empirical probability distributions of daily, monthly, and annual
precipitation for West Glacier, Montana, USA. Precipitation amounts have
been normalized by the mean for each time scale, and are plot ted on anormal
probability scale.
5.00~---------------------------------------------'
61.00
....
J!I
'0..
'2 0 . 50
'Q.
i
~ 0 0.10
z
0.05
.01
. -
• .o • •
.05.1 .2
.5
.- '
•
Annual
X ~eglember Monthl
0 +
e lernber Weekly
e lernber Daily
.8 .9 .95
.99
Cumulatlve Probablllly
variance of the distribution; variance increases with slope. Clearly, the distributions become less variable, and more closely approximate the normal
distribution, as the time scale increases. The reason for the tendency toward normality is explained by the central limit theorem, which states that,
under fairly general conditions, the sum of independent random variables
approaches normal.
At time scales where the normal distribution is not appropriate, a number
of other distributions have been fit to precipitation amounts. At the daily
time scale, the exponential, mixed exponential, gamma, and Kappa distributions have been used (Foufoula-Georgiou, 1985). Woolhiser and Roldhan
(1982) applied several candidate distributions for daily precipitation to five
stations located throughout the U.S., and found that the mixed exponential
performed the best. At longer time scales, distributions such as the lognormal or gamma, which can be obtained from the normal distribution via
transformation, have often been applied.
The spatial correlation of precipitation is also strongly dependent on the
time scale. Figure 11.2 shows schematically typical variations in the spatial
correlation with time period, and by season, which would be appropriate
to much of North America and northern Eurasia. The correlation length