

Section 10.3: Measures and Relationships
185
10.3 Measures and Relationships:
Categorical Forecasts
Under ideal circumstances continuous forecasts (i.e. quantitative forecasts
of the predictand) are preferred to categorical forecasts (forecasts of a range
of values of the predictand). However, when predictability is modest (as
it is in most climate predictions) the specificity and detail of continuous
forecasts are often unwarranted. Additionally, it is often much easier to cast
prob ability forecasts in terms of probabilities of categories than to specify the
full fore cast prob ability distribution. The information in the first subsection
below is partially drawn from Murphy and Winkler (1987), and that in the
second condensed from Barnston (1992) and Ward and Folland (1991).
10.3.1 Contingency and Definitions
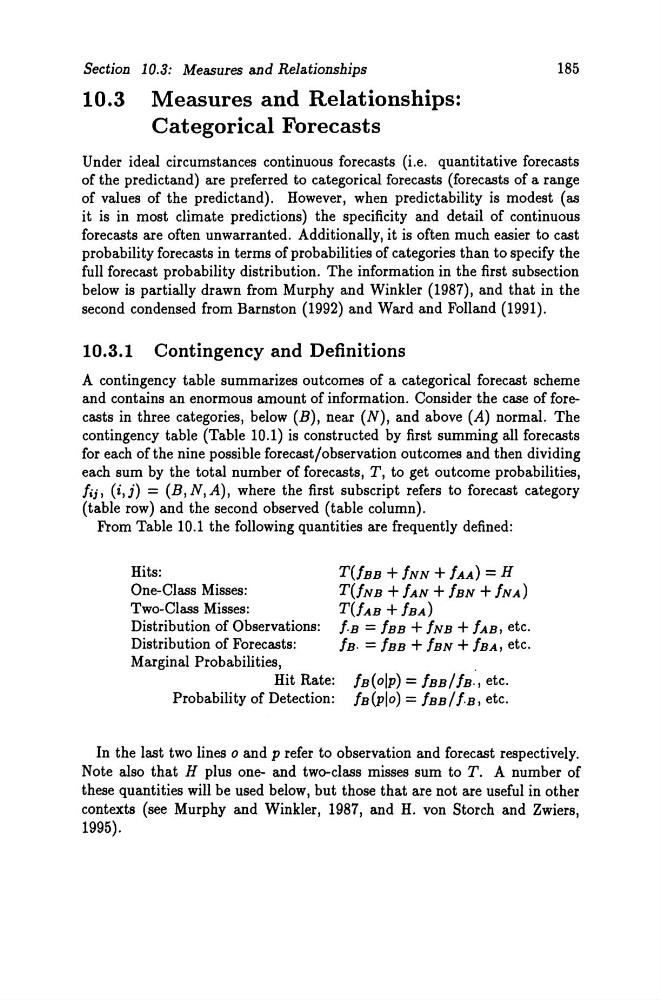
A contingency table summarizes outcomes of a categorical forecast scheme
and contains an enormous amount of information. Consider the case of forecasts in three categories, below (B), near (N), and above (A) normal. The
contingency table (Table 10.1) is constructed by first summing all forecasts
for each ofthe nine possible forecast/observation outcomes and then dividing
each sum by the total number of forecasts, T, to get outcome probabilities,
lij, (i,j) = (B,N,A), where the first subscript refers to forecast category
(table row) and the second observed (table column).
From Table 10.1 the following quantities are frequently defined:
Hits:
One-Class Misses:
Two-Class Misses:
Distribution of Observations:
Distribution of Forecasts:
Marginal Probabilities,
Hit Rate:
Probability of Detection:
T(fBB + INN + IAA) = H
T(fNB + IAN + IBN + INA)
T(fAB + IBA)
f.B = !BB + INB + lAB, etc.
IB. = IBB + IBN + IBA, etc.
IB(olp) = IBB/IB., etc.
IB(plo) = IBB/f.B, etc.
In the last two lines 0 and P refer to observation and forecast respectively.
Note also that H plus one- and two-class misses sum to T. A number of
these quantities will be used below, but those that are not are useful in other
contexts (see Murphy and Winkler, 1987, and H. von Storch and Zwiers,
1995).
185
10.3 Measures and Relationships:
Categorical Forecasts
Under ideal circumstances continuous forecasts (i.e. quantitative forecasts
of the predictand) are preferred to categorical forecasts (forecasts of a range
of values of the predictand). However, when predictability is modest (as
it is in most climate predictions) the specificity and detail of continuous
forecasts are often unwarranted. Additionally, it is often much easier to cast
prob ability forecasts in terms of probabilities of categories than to specify the
full fore cast prob ability distribution. The information in the first subsection
below is partially drawn from Murphy and Winkler (1987), and that in the
second condensed from Barnston (1992) and Ward and Folland (1991).
10.3.1 Contingency and Definitions
A contingency table summarizes outcomes of a categorical forecast scheme
and contains an enormous amount of information. Consider the case of forecasts in three categories, below (B), near (N), and above (A) normal. The
contingency table (Table 10.1) is constructed by first summing all forecasts
for each ofthe nine possible forecast/observation outcomes and then dividing
each sum by the total number of forecasts, T, to get outcome probabilities,
lij, (i,j) = (B,N,A), where the first subscript refers to forecast category
(table row) and the second observed (table column).
From Table 10.1 the following quantities are frequently defined:
Hits:
One-Class Misses:
Two-Class Misses:
Distribution of Observations:
Distribution of Forecasts:
Marginal Probabilities,
Hit Rate:
Probability of Detection:
T(fBB + INN + IAA) = H
T(fNB + IAN + IBN + INA)
T(fAB + IBA)
f.B = !BB + INB + lAB, etc.
IB. = IBB + IBN + IBA, etc.
IB(olp) = IBB/IB., etc.
IB(plo) = IBB/f.B, etc.
In the last two lines 0 and P refer to observation and forecast respectively.
Note also that H plus one- and two-class misses sum to T. A number of
these quantities will be used below, but those that are not are useful in other
contexts (see Murphy and Winkler, 1987, and H. von Storch and Zwiers,
1995).