

Section 9.4: Serial Correlation
173
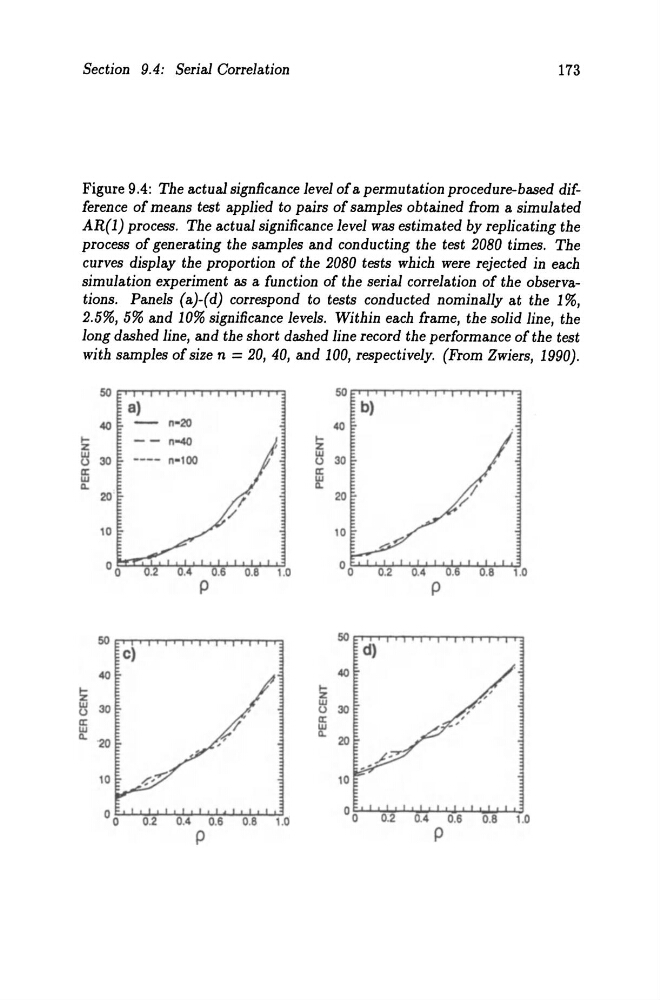
Figure 9.4: The actual signficance level of apermutation procedure-based difference of means test applied to pairs of samples obtained from a simulated
AR(l) process. The actual significance level was estimated by replicating the
process of generating the samples and conducting the test 2080 times. The
curves display the proportion of the 2080 tests which were rejected in each
simulation experiment as a function of the serial correlation of the observations. Panels (a)-( d) correspond to tests conducted nominally at the 1 %,
2.5%, 5% and 10% significance levels. Within each frame, the solid line, the
long dashed line, and the short dashed line record the performance of the test
with samples of size n = 20, 40, and 100, respectively. (From Zwiers, 1990).
a)
040
n-20
!z
n-040
~ 30
---- n-1()O
ffi
11.
20
10
p
c)
040
!z
~ 30
a:
w
11."20
10
0 0
0.2
0.4 0.6
0.8 1.0
P
!z
w
u
a:
~
40
b)
d)
00
0.2
0.4
0.6
0.8
1.0
p
173
Figure 9.4: The actual signficance level of apermutation procedure-based difference of means test applied to pairs of samples obtained from a simulated
AR(l) process. The actual significance level was estimated by replicating the
process of generating the samples and conducting the test 2080 times. The
curves display the proportion of the 2080 tests which were rejected in each
simulation experiment as a function of the serial correlation of the observations. Panels (a)-( d) correspond to tests conducted nominally at the 1 %,
2.5%, 5% and 10% significance levels. Within each frame, the solid line, the
long dashed line, and the short dashed line record the performance of the test
with samples of size n = 20, 40, and 100, respectively. (From Zwiers, 1990).
a)
040
n-20
!z
n-040
~ 30
---- n-1()O
ffi
11.
20
10
p
c)
040
!z
~ 30
a:
w
11."20
10
0 0
0.2
0.4 0.6
0.8 1.0
P
!z
w
u
a:
~
40
b)
d)
00
0.2
0.4
0.6
0.8
1.0
p