

156
Chapter 8: Statistical Analysis oE GCM Output
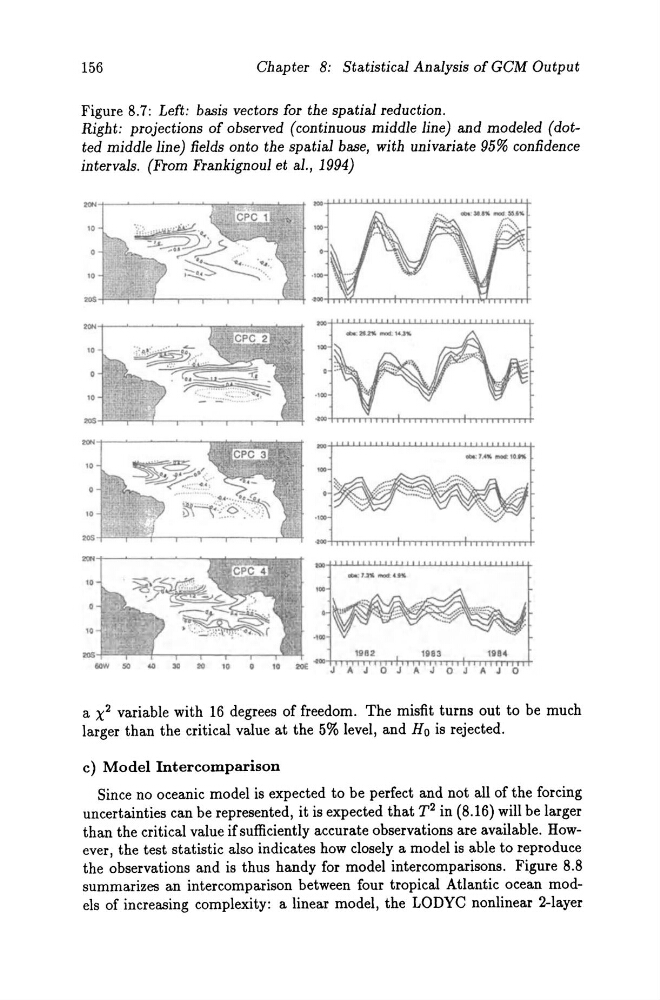
Figure 8.7: LeEt: basis vectors Eor the spatial reduction.
Right: projections oE observed (continuous middle line) and modeled (dotted middle line) fields onto the spatial base, with univariate 95% confidence
intervals. (From Frankignoul et a1., 1994)
10
10
1983
11184
20
10
10
A J O J A J O
a X 2 variable with 16 degrees of freedom. The misfit turns out to be much
larger than the critical value at the 5% level, and Ho is rejected.
c) Model Intercomparison
Since no oceanic model is expected to be perfeet and not all of the forcing
uncertainties can be represented, it is expected that T 2 in (8.16) will be larger
than the critical value if sufficiently accurate observations are available. However, the test statistic also indicates how closely a model is able to reproduce
the observations and is thus handy for model intercomparisons. Figure 8.8
summarizes an intercomparison between four tropical Atlantic ocean models of increasing complexity: a linear model, the LODYC nonlinear 2-layer
Chapter 8: Statistical Analysis oE GCM Output
Figure 8.7: LeEt: basis vectors Eor the spatial reduction.
Right: projections oE observed (continuous middle line) and modeled (dotted middle line) fields onto the spatial base, with univariate 95% confidence
intervals. (From Frankignoul et a1., 1994)
10
10
1983
11184
20
10
10
A J O J A J O
a X 2 variable with 16 degrees of freedom. The misfit turns out to be much
larger than the critical value at the 5% level, and Ho is rejected.
c) Model Intercomparison
Since no oceanic model is expected to be perfeet and not all of the forcing
uncertainties can be represented, it is expected that T 2 in (8.16) will be larger
than the critical value if sufficiently accurate observations are available. However, the test statistic also indicates how closely a model is able to reproduce
the observations and is thus handy for model intercomparisons. Figure 8.8
summarizes an intercomparison between four tropical Atlantic ocean models of increasing complexity: a linear model, the LODYC nonlinear 2-layer