

150
Chapter 8: Statistical Analysis of GCM Output
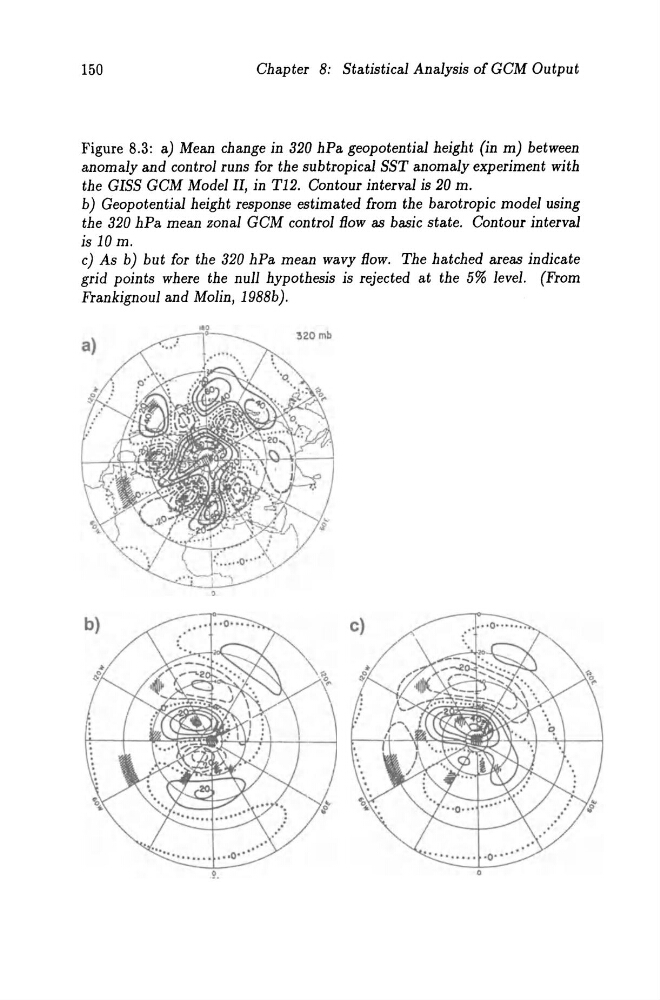
Figure 8.3: a) Mean change in 320 hPa geopotential height (in m) between
anomaly and control runs for the subtropical SST anomaly experiment with
the GISS GCM Model II, in T12. Contour interval is 20 m.
b) Geopotential height response estimated from the barotropic model using
the 320 hPa mean zonal GCM control flow as basic state. Contour interval
is 10 m.
c) As b) but for the 320 hPa mean wavy flow. The hatched areas indicate
grid points where the null hypothesis is rejected at the 5% level. (From
Frankignoul and Molin, 1988b).
Chapter 8: Statistical Analysis of GCM Output
Figure 8.3: a) Mean change in 320 hPa geopotential height (in m) between
anomaly and control runs for the subtropical SST anomaly experiment with
the GISS GCM Model II, in T12. Contour interval is 20 m.
b) Geopotential height response estimated from the barotropic model using
the 320 hPa mean zonal GCM control flow as basic state. Contour interval
is 10 m.
c) As b) but for the 320 hPa mean wavy flow. The hatched areas indicate
grid points where the null hypothesis is rejected at the 5% level. (From
Frankignoul and Molin, 1988b).