

148
Ghapter 8: Statistical Analysis of GGM Output
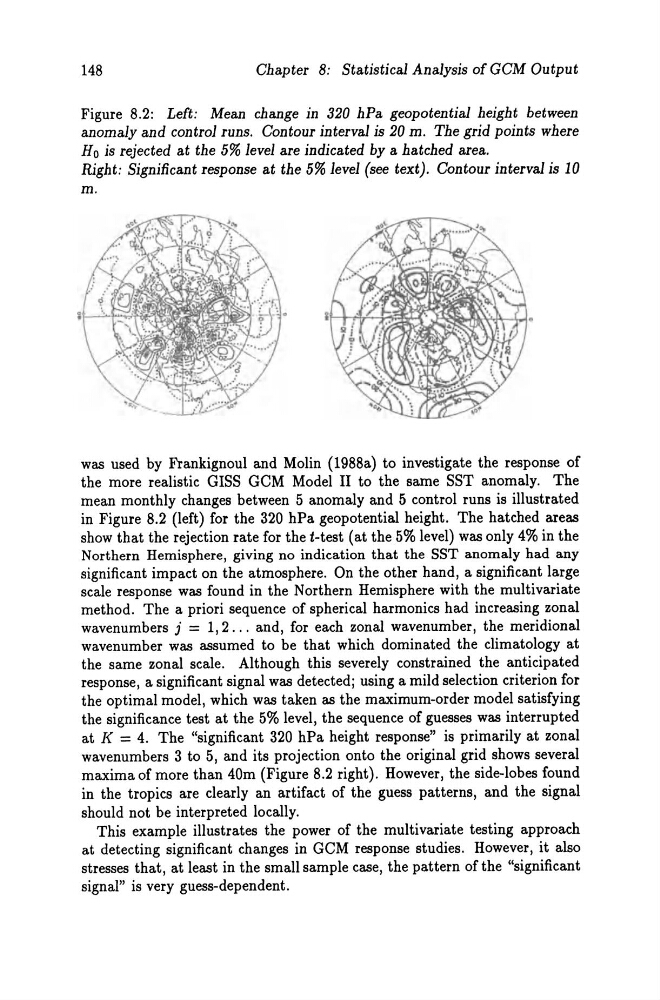
Figure 8.2: Left: Mean change in 320 hPa geopotential height between
anomaly and contro] runs. Gon tour interval is 20 m. The grid points where
Ho is rejected at the 5% level are indicated by a hatched area.
Right: Significant response at the 5% level (see text) . Gontour interval is 10
m.
was used by Frankignoul and Molin (1988a) to investigate the response of
the more realistic GISS GCM Model II to the same SST anomaly. The
mean monthly changes between 5 anomaly and 5 control runs is illustrated
in Figure 8.2 (left) for the 320 hPa geopotential height. The hatched areas
show that the rejection rate for the t-test (at the 5% level) was only 4% in the
Northern Hemisphere, giving no indication that the SST anomaly had any
significant impact on the atmosphere. On the other hand, a significant large
scale response was found in the Northern Hemisphere with the multivariate
method. The apriori sequence of spherical harmonics had increasing zonal
wavenumbers j = 1,2 .. . and, for each zonal wavenumber, the meridional
wavenumber was assumed to be that which dominated the climatology at
the same zonal scale. Although this severely constrained the anticipated
response, a significant signal was detectedj using a mild selection criterion for
the optimal model, which was taken as the maximum-order model satisfying
the significance test at the 5% level, the sequence of guesses was interrupted
at K = 4. The "significant 320 hPa height response" is primarily at zonal
wavenumbers 3 to 5, and its projection onto the original grid shows several
maxima of more than 40m (Figure 8.2 right). However, the side-Iobes found
in the tropics are clearly an artifact of the guess patterns, and the signal
should not be interpreted locally.
This example illustrates the power of the multivariate testing approach
at detecting significant changes in GCM response studies. However, it also
stresses that, at least in the small sampie case, the pattern of the "significant
signal" is very guess-dependent.
Ghapter 8: Statistical Analysis of GGM Output
Figure 8.2: Left: Mean change in 320 hPa geopotential height between
anomaly and contro] runs. Gon tour interval is 20 m. The grid points where
Ho is rejected at the 5% level are indicated by a hatched area.
Right: Significant response at the 5% level (see text) . Gontour interval is 10
m.
was used by Frankignoul and Molin (1988a) to investigate the response of
the more realistic GISS GCM Model II to the same SST anomaly. The
mean monthly changes between 5 anomaly and 5 control runs is illustrated
in Figure 8.2 (left) for the 320 hPa geopotential height. The hatched areas
show that the rejection rate for the t-test (at the 5% level) was only 4% in the
Northern Hemisphere, giving no indication that the SST anomaly had any
significant impact on the atmosphere. On the other hand, a significant large
scale response was found in the Northern Hemisphere with the multivariate
method. The apriori sequence of spherical harmonics had increasing zonal
wavenumbers j = 1,2 .. . and, for each zonal wavenumber, the meridional
wavenumber was assumed to be that which dominated the climatology at
the same zonal scale. Although this severely constrained the anticipated
response, a significant signal was detectedj using a mild selection criterion for
the optimal model, which was taken as the maximum-order model satisfying
the significance test at the 5% level, the sequence of guesses was interrupted
at K = 4. The "significant 320 hPa height response" is primarily at zonal
wavenumbers 3 to 5, and its projection onto the original grid shows several
maxima of more than 40m (Figure 8.2 right). However, the side-Iobes found
in the tropics are clearly an artifact of the guess patterns, and the signal
should not be interpreted locally.
This example illustrates the power of the multivariate testing approach
at detecting significant changes in GCM response studies. However, it also
stresses that, at least in the small sampie case, the pattern of the "significant
signal" is very guess-dependent.