

128
Chapter 7: The Simulation of Weather Types in GCMs
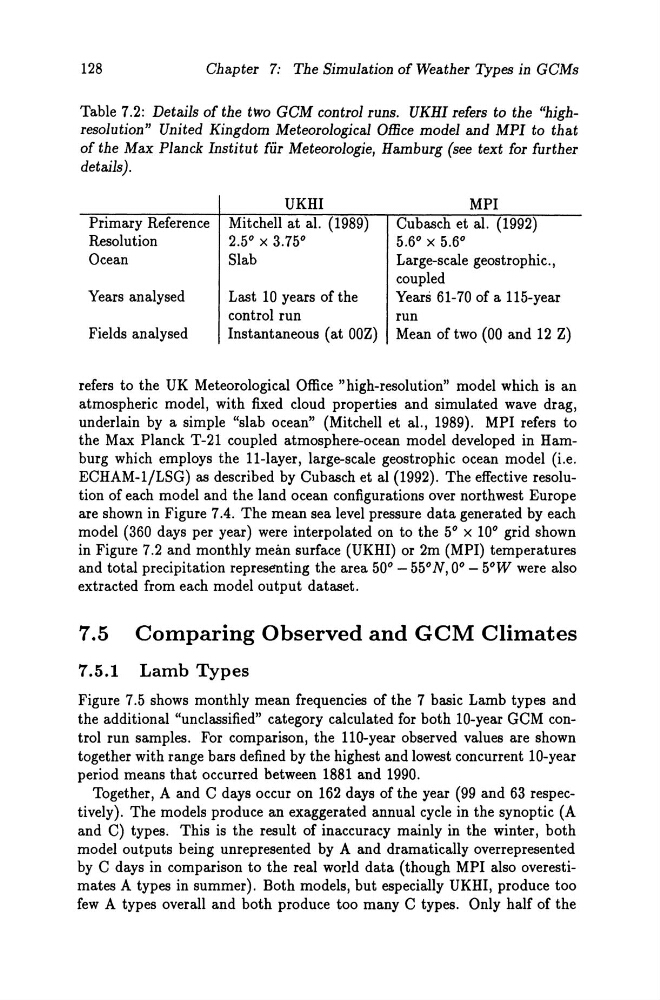
Table 7.2: Details of the two GCM eontrol runs. UKHI refers to the "highresolution" United Kingdom Meteorologieal Offiee model and MPI to that
of the Max Planek Institut für Meteorologie, Hamburg (see text for further
details).
Primary Referenee
Resolution
Oeean
Years analysed
Fields analysed
UKHI
Mitehell at al. (1989)
2.5° x 3.75°
Slab
Last 10 years of the
control run
Instantaneous (at OOZ)
MPI
Cubaseh et al. (1992)
5.6° x 5.6°
Large-seale geostrophie.,
eoupled
Years 61-70 of a 1I5-year
run
Mean of two (00 and 12 Z)
refers to the UK Meteorological Office "high-resolution" model which is an
atmospheric model, with fixed doud properties and simulated wave drag,
underlain by a simple "sI ab ocean" (Mitehell et al. , 1989). MPI refers to
the Max Planek T-21 eoupled atmosphere-oeean model developed in Hamburg whieh employs the lI-layer, large-seale geostrophie oeean model (i.e.
ECHAM-1/LSG) as described by Cubasch et al (1992). The effective resolution of eaeh model and the land ocean eonfigurations over northwest Europe
are shown in Figure 7.4. The mean sea level pressure data generated by each
model (360 days per year) were interpolated on to the 5° x 10° grid shown
in Figure 7.2 and monthly mean surface (UKHI) or 2m (MPI) temperatures
and total preeipitation representing the area 50° - 55° N, 0° - 5°W were also
extraeted from eaeh model output dataset.
7.5 Comparing Observed and GCM Climates
7.5.1 Lamb Types
Figure 7.5 shows monthly mean frequencies of the 7 basic Lamb types and
the additional "undassified" category ealeulated for both 10-year GCM eontrol run sampIes. For comparison, the 1I0-year observed values are shown
together with range bars defined by the highest and lowest eoncurrent 10-year
period means that oeeurred between 1881 and 1990.
Together, A and C days oecur on 162 days of the year (99 and 63 respeetively). The models produce an exaggerated annual eyde in the synoptic (A
and C) types. This is the result of inaecuracy mainly in the winter, both
model outputs being unrepresented by A and dramatically overrepresented
by C days in comparison to the real world data (though MPI also overestimates A types in summer). Both models, but especially UKHI, produee too
few A types overall and both produce too many C types. Only half of the
Chapter 7: The Simulation of Weather Types in GCMs
Table 7.2: Details of the two GCM eontrol runs. UKHI refers to the "highresolution" United Kingdom Meteorologieal Offiee model and MPI to that
of the Max Planek Institut für Meteorologie, Hamburg (see text for further
details).
Primary Referenee
Resolution
Oeean
Years analysed
Fields analysed
UKHI
Mitehell at al. (1989)
2.5° x 3.75°
Slab
Last 10 years of the
control run
Instantaneous (at OOZ)
MPI
Cubaseh et al. (1992)
5.6° x 5.6°
Large-seale geostrophie.,
eoupled
Years 61-70 of a 1I5-year
run
Mean of two (00 and 12 Z)
refers to the UK Meteorological Office "high-resolution" model which is an
atmospheric model, with fixed doud properties and simulated wave drag,
underlain by a simple "sI ab ocean" (Mitehell et al. , 1989). MPI refers to
the Max Planek T-21 eoupled atmosphere-oeean model developed in Hamburg whieh employs the lI-layer, large-seale geostrophie oeean model (i.e.
ECHAM-1/LSG) as described by Cubasch et al (1992). The effective resolution of eaeh model and the land ocean eonfigurations over northwest Europe
are shown in Figure 7.4. The mean sea level pressure data generated by each
model (360 days per year) were interpolated on to the 5° x 10° grid shown
in Figure 7.2 and monthly mean surface (UKHI) or 2m (MPI) temperatures
and total preeipitation representing the area 50° - 55° N, 0° - 5°W were also
extraeted from eaeh model output dataset.
7.5 Comparing Observed and GCM Climates
7.5.1 Lamb Types
Figure 7.5 shows monthly mean frequencies of the 7 basic Lamb types and
the additional "undassified" category ealeulated for both 10-year GCM eontrol run sampIes. For comparison, the 1I0-year observed values are shown
together with range bars defined by the highest and lowest eoncurrent 10-year
period means that oeeurred between 1881 and 1990.
Together, A and C days oecur on 162 days of the year (99 and 63 respeetively). The models produce an exaggerated annual eyde in the synoptic (A
and C) types. This is the result of inaecuracy mainly in the winter, both
model outputs being unrepresented by A and dramatically overrepresented
by C days in comparison to the real world data (though MPI also overestimates A types in summer). Both models, but especially UKHI, produee too
few A types overall and both produce too many C types. Only half of the