

Section 7.3: An "Objective" Lamb Classification
125
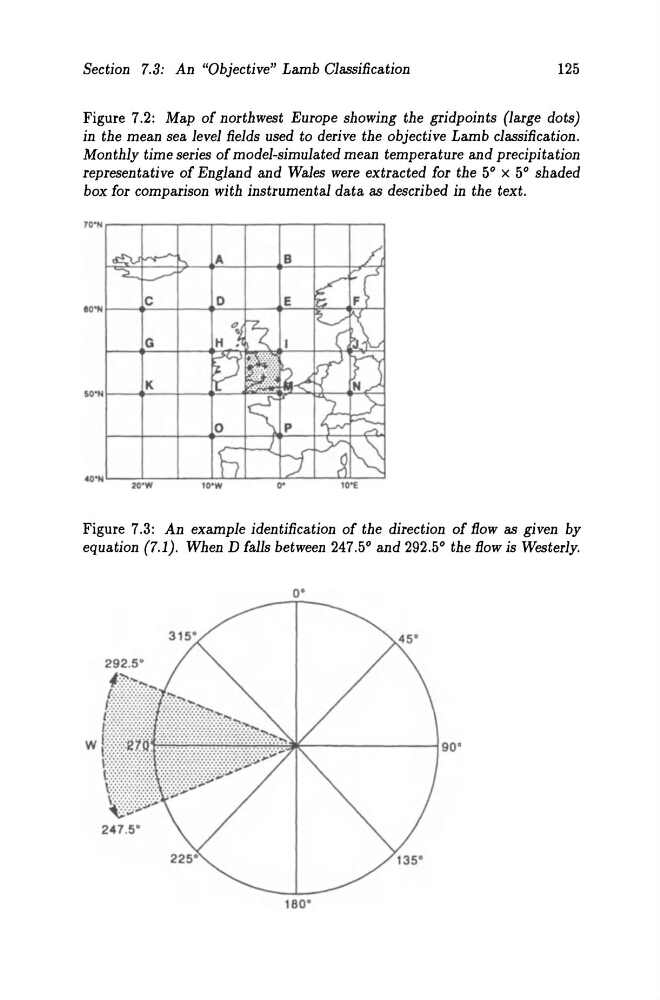
Figure 7.2: Map of northwest Europe showing the gridpoints (large dots)
in the mean sea level fields used to derive the objective Lamb classification.
Monthly time series of model-simulated mean temperature and precipitation
representative of England and Wales were extracted for the 5° x 5° shaded
box for comparison with instrumental data as described in the text.
70'N r---..,....-...,....-...,....--r"-"-T"--r-~----,
Figure 7.3: An example identification of the direction of fIow as given by
equation (7.1). When D falls between 247.5° and 292.5° the fIow is Westerly.
O·
180·
125
Figure 7.2: Map of northwest Europe showing the gridpoints (large dots)
in the mean sea level fields used to derive the objective Lamb classification.
Monthly time series of model-simulated mean temperature and precipitation
representative of England and Wales were extracted for the 5° x 5° shaded
box for comparison with instrumental data as described in the text.
70'N r---..,....-...,....-...,....--r"-"-T"--r-~----,
Figure 7.3: An example identification of the direction of fIow as given by
equation (7.1). When D falls between 247.5° and 292.5° the fIow is Westerly.
O·
180·