

Section 6.5: JAS Sahel Rainfall Links
115
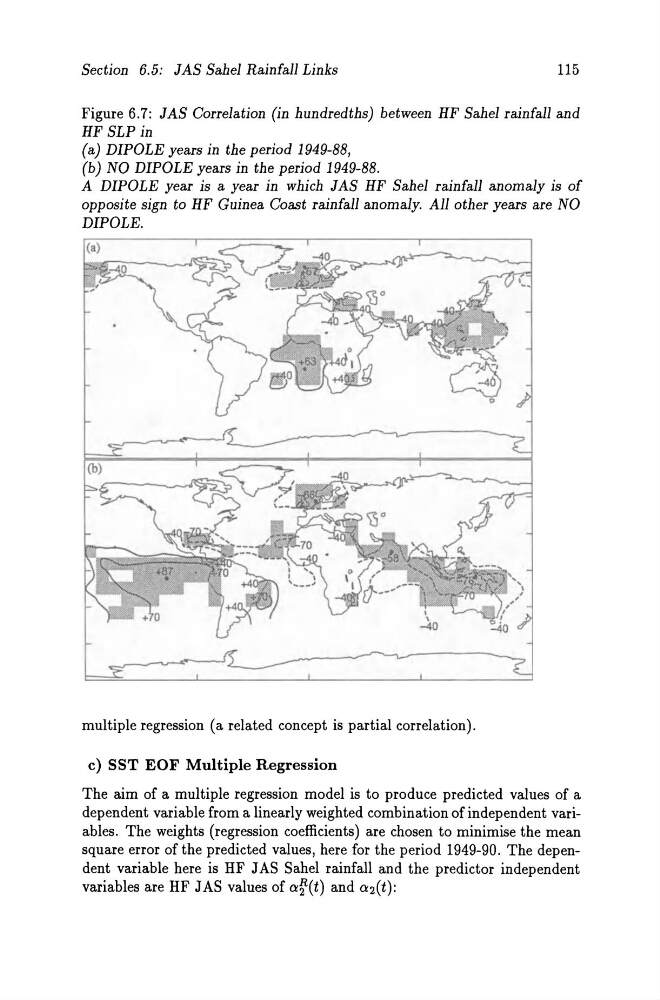
Figure 6.7: JAS Correlation (in hundredths) between HF Sahel rainfall and
HF SLP in
(a) DIPOLE years in the period 1949-88,
(b) NO DIPOLE years in the period 1949-88.
A DIPOLE year is a year in which JAS HF Sahel rainfall anomaly is of
opposite sign to HF Guinea Coast rainfall anomaly. All other years are NO
DIPOLE.
multiple regression (a related concept is partial correlation).
c) SST EOF Multiple Regression
The aim of a multiple regression model is to produce predicted values of a
dependent variable from a linearly weighted combination of independent variables. The weights (regression coefficients) are chosen to minimise the mean
square error of the predicted values, here for the period 1949-90. The dependent variable here is HF JAS Sahel rainfall and the predictor independent
variables are HF JAS values of o:r(t) and O:2(t):
115
Figure 6.7: JAS Correlation (in hundredths) between HF Sahel rainfall and
HF SLP in
(a) DIPOLE years in the period 1949-88,
(b) NO DIPOLE years in the period 1949-88.
A DIPOLE year is a year in which JAS HF Sahel rainfall anomaly is of
opposite sign to HF Guinea Coast rainfall anomaly. All other years are NO
DIPOLE.
multiple regression (a related concept is partial correlation).
c) SST EOF Multiple Regression
The aim of a multiple regression model is to produce predicted values of a
dependent variable from a linearly weighted combination of independent variables. The weights (regression coefficients) are chosen to minimise the mean
square error of the predicted values, here for the period 1949-90. The dependent variable here is HF JAS Sahel rainfall and the predictor independent
variables are HF JAS values of o:r(t) and O:2(t):