

Section 6.5: JAS Sabel Rainfall Links
113
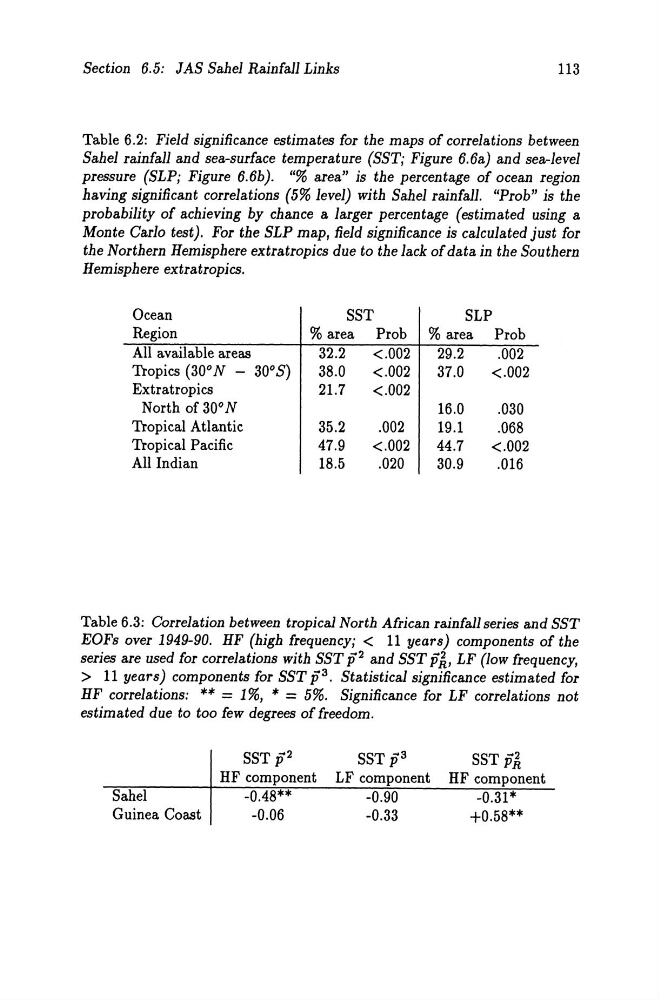
Table 6.2: Field significance estimates for the maps of correlations between
Sabel rainfall and sea-surface temperature (SST; Figure 6.6a) and sea-level
press ure (SLPj Figure 6.6b). "% area" is the percentage of ocean region
having significant correlations (5% level) with Sabel rainfall. "Prob" is the
probability of achieving by chance a larger percentage (estimated using a
Monte Carlo test). For the SLP map, field significance is calculated just for
the Northern Hemisphere extratropics due to the lack of data in the Southern
Hemisphere extratropics.
Ocean
SST
SLP
Region
% area Prob % area Prob
All available areas
32.2
<.002
29.2
.002
Tropics (30° N - 30° S)
38.0
<.002
37.0
<.002
Extratropics
21.7
<.002
North of 30° N
16.0
.030
Tropical Atlantic
35.2
.002
19.1
.068
Tropical Pacific
47.9
<.002
44.7
<.002
All Indian
18.5
.020
30.9
.016
Table 6.3: Correlation between tropical North African rainfall series and SST
EOFs over 1949-90. HF (high frequency; < 11 years) components of the
series are used for correlations with SST p 2 and SST PÄ, LF (low frequency,
> 11 years) components for SST p 3 • Statistical significance estimated for
HF correlations: ** = 1 %, * = 5%. Significance for LF correlations not
estimated due to too few degrees of freedom.
SST p2
HF component
Sahel
-0.48**
Guinea Coast
-0.06
SST p3
LF component
-0.90
-0.33
SSTPÄ
HF component
-0.31*
+0.58**
113
Table 6.2: Field significance estimates for the maps of correlations between
Sabel rainfall and sea-surface temperature (SST; Figure 6.6a) and sea-level
press ure (SLPj Figure 6.6b). "% area" is the percentage of ocean region
having significant correlations (5% level) with Sabel rainfall. "Prob" is the
probability of achieving by chance a larger percentage (estimated using a
Monte Carlo test). For the SLP map, field significance is calculated just for
the Northern Hemisphere extratropics due to the lack of data in the Southern
Hemisphere extratropics.
Ocean
SST
SLP
Region
% area Prob % area Prob
All available areas
32.2
<.002
29.2
.002
Tropics (30° N - 30° S)
38.0
<.002
37.0
<.002
Extratropics
21.7
<.002
North of 30° N
16.0
.030
Tropical Atlantic
35.2
.002
19.1
.068
Tropical Pacific
47.9
<.002
44.7
<.002
All Indian
18.5
.020
30.9
.016
Table 6.3: Correlation between tropical North African rainfall series and SST
EOFs over 1949-90. HF (high frequency; < 11 years) components of the
series are used for correlations with SST p 2 and SST PÄ, LF (low frequency,
> 11 years) components for SST p 3 • Statistical significance estimated for
HF correlations: ** = 1 %, * = 5%. Significance for LF correlations not
estimated due to too few degrees of freedom.
SST p2
HF component
Sahel
-0.48**
Guinea Coast
-0.06
SST p3
LF component
-0.90
-0.33
SSTPÄ
HF component
-0.31*
+0.58**