

98
Chapter 6: Analysing the Boreal Summer Relationship
6.3 Characteristic Patterns of Global Sea
Surface Ternperature: EOFs and Rotated
EOFs
6.3.1 Introduction
Various statistical methods have been used to identify the nature oftemporal
and spatial SST variability. EOF analysis of SST anomaly data identifies patterns of co-variability in the data, and provides time-series (time coefficients)
that describe each pattern's temporal variability. This Section describes an
EOF analysis of global SST data (Folland et al. , 1991), and presents three
of the EOF patterns that turn out to have strong atmospheric variability
associated with them (discussed in Sections 6.4-6.5).
6.3.2 SST Data
Ship observations of SST are now compiled into large computerised datasets.
The data used here are taken from the Meteorologicai Office Historical SST
dataset (MOHSST) (Bottomley et al., 1990). Prior to about 1942, observations were taken using uninsulated canvas buckets, and this led to measured
temperatures being too low. Corrections, which are of the order of 0.3°C,
have been calculated and applied to the data used here (FolIand, 1991). The
corrected data are averaged into seasonal anomalies from a 1951-80 climatology for each 10° lat x 10° long ocean grid-box. Ship observations do not
cover the whole ocean, so the data set has no data for some grid-boxes in
some seasons. Data coverage is particularly poor in the Southern Ocean. The
EOF analysis summarised in this Section (Folland et al., 1991) used data for
1901-80. All grid-boxes with less than 60% of data present 1901-80 were
excluded from the analysis. There were 297 grid-boxes that qualified for the
analysis. In EOF analysis, the time-series for each grid-box must have no
missing data. So missing data in the 297 time-series were interpolated using
Chebychev Polynomials.
6.3.3 EOF method
The concept of Empirical Orthogonal Functions (EOFs) is spelled out in
so me detail in Section 13.3, here only a brief summary is given to clarify the
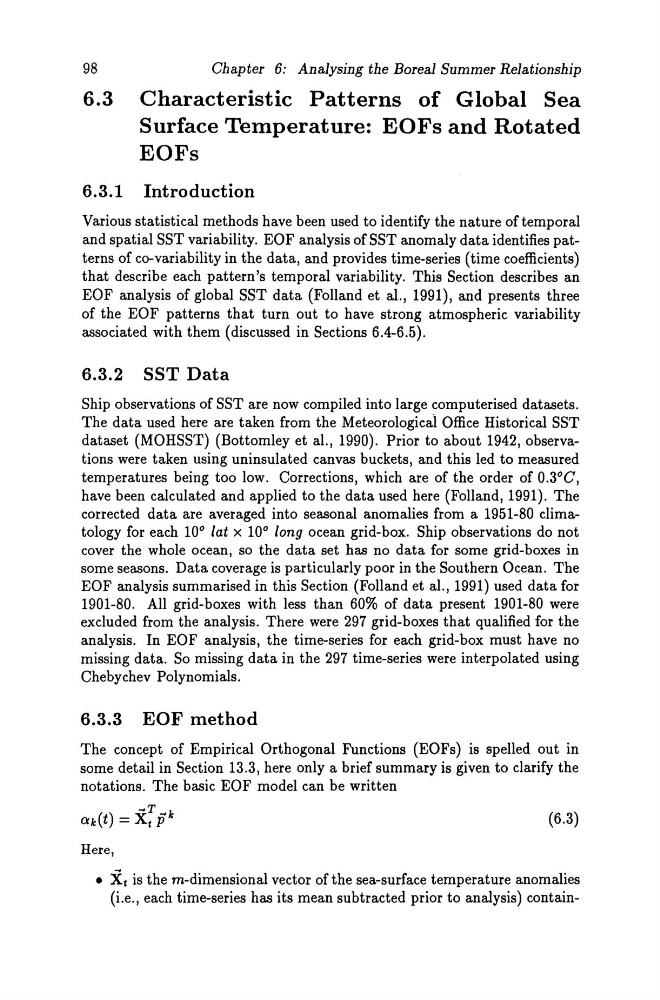
notations. The basic EOF model can be written
(6.3)
Here,
• Xt is the rn-dimensional vector of the sea-surface temperature anomalies
(i.e., each time-series has its mean subtracted prior to analysis) contain-
Chapter 6: Analysing the Boreal Summer Relationship
6.3 Characteristic Patterns of Global Sea
Surface Ternperature: EOFs and Rotated
EOFs
6.3.1 Introduction
Various statistical methods have been used to identify the nature oftemporal
and spatial SST variability. EOF analysis of SST anomaly data identifies patterns of co-variability in the data, and provides time-series (time coefficients)
that describe each pattern's temporal variability. This Section describes an
EOF analysis of global SST data (Folland et al. , 1991), and presents three
of the EOF patterns that turn out to have strong atmospheric variability
associated with them (discussed in Sections 6.4-6.5).
6.3.2 SST Data
Ship observations of SST are now compiled into large computerised datasets.
The data used here are taken from the Meteorologicai Office Historical SST
dataset (MOHSST) (Bottomley et al., 1990). Prior to about 1942, observations were taken using uninsulated canvas buckets, and this led to measured
temperatures being too low. Corrections, which are of the order of 0.3°C,
have been calculated and applied to the data used here (FolIand, 1991). The
corrected data are averaged into seasonal anomalies from a 1951-80 climatology for each 10° lat x 10° long ocean grid-box. Ship observations do not
cover the whole ocean, so the data set has no data for some grid-boxes in
some seasons. Data coverage is particularly poor in the Southern Ocean. The
EOF analysis summarised in this Section (Folland et al., 1991) used data for
1901-80. All grid-boxes with less than 60% of data present 1901-80 were
excluded from the analysis. There were 297 grid-boxes that qualified for the
analysis. In EOF analysis, the time-series for each grid-box must have no
missing data. So missing data in the 297 time-series were interpolated using
Chebychev Polynomials.
6.3.3 EOF method
The concept of Empirical Orthogonal Functions (EOFs) is spelled out in
so me detail in Section 13.3, here only a brief summary is given to clarify the
notations. The basic EOF model can be written
(6.3)
Here,
• Xt is the rn-dimensional vector of the sea-surface temperature anomalies
(i.e., each time-series has its mean subtracted prior to analysis) contain-