

74
:s
:s
C
CD
CD
102 :
10'
10'
Q
100
J.D. Albertson, G. Kiely and M.B. Parlange
r2/3
r (m)
r2/3
r (m)
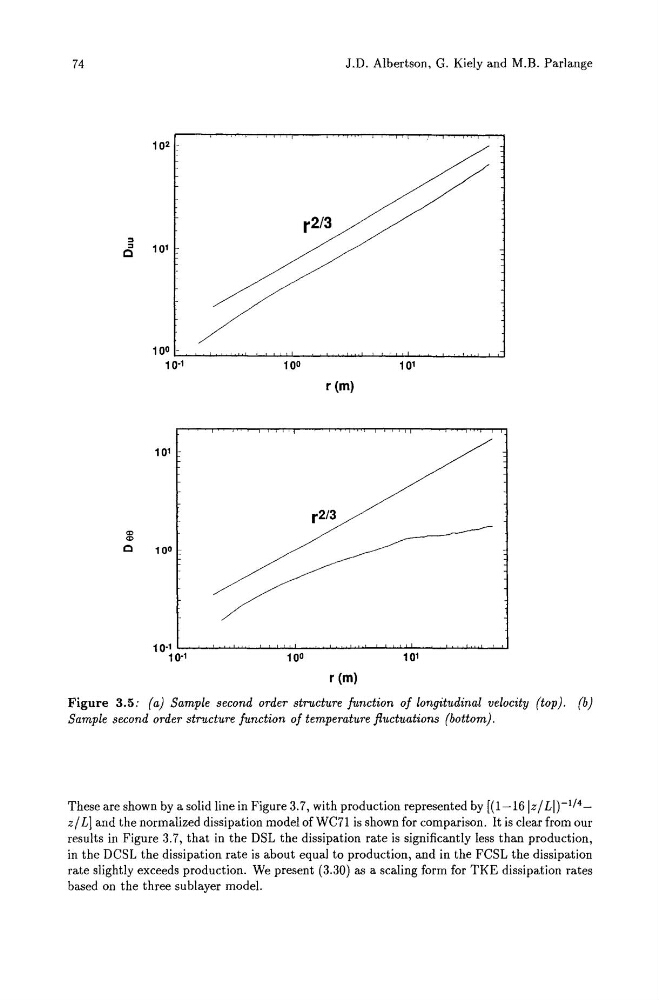
Figure 3.5: (a) Sample second order structure function of longitudinal velocity (top). (b)
Sample second order structure function of temperature fluctuations (bottom).
These are shown by a solid line in Figure 3.7, with production represented by [( 1-161z / LI)-I/4_
z / L] and the normalized dissipation model of WC71 is shown for comparison. It is clear from our
results in Figure 3.7, that in the DSL the dissipation rate is significantly less than production,
in the DCSL the dissipation rate is about equal to production, and in the FCSL the dissipation
rate slightly exceeds production. We present (3.30) as a scaling form for TKE dissipation rates
based on the three sublayer model.
:s
:s
C
CD
CD
102 :
10'
10'
Q
100
J.D. Albertson, G. Kiely and M.B. Parlange
r2/3
r (m)
r2/3
r (m)
Figure 3.5: (a) Sample second order structure function of longitudinal velocity (top). (b)
Sample second order structure function of temperature fluctuations (bottom).
These are shown by a solid line in Figure 3.7, with production represented by [( 1-161z / LI)-I/4_
z / L] and the normalized dissipation model of WC71 is shown for comparison. It is clear from our
results in Figure 3.7, that in the DSL the dissipation rate is significantly less than production,
in the DCSL the dissipation rate is about equal to production, and in the FCSL the dissipation
rate slightly exceeds production. We present (3.30) as a scaling form for TKE dissipation rates
based on the three sublayer model.