

584
0.4~------------------------------------'
; 0.35
8 0.3
' S 0.25
. .
~ 0.2
~
1 0 . 15
~ 0.1
j 0.05
Dens. Vegetation
Dons. Agricuthral and Rangeland Vegetation
~ Arabi. son
J
O~--~~--~---r~+-~r-~--~--~--~
-5
o 5 10 15 20 25 30 35 40 45
(TI9V + 1'37V)/2 - (TI9H + 1'3711)/2
J. Noll
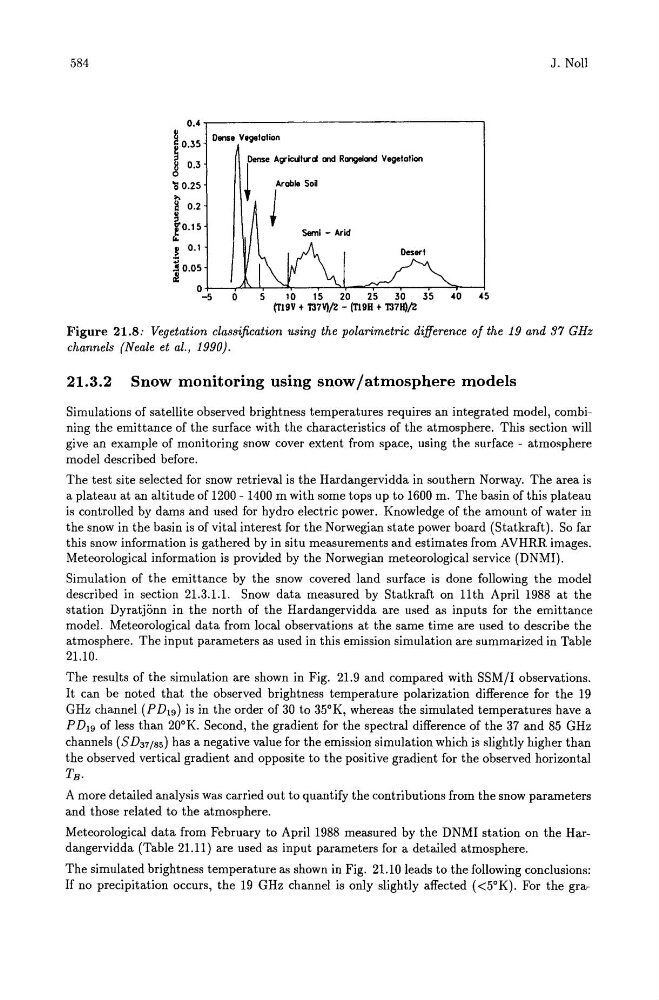
Figure 21.8: Vegetation classification using the polarimetric difference of the 19 and 37 GHz
channels (Neale et al., 1990).
21.3.2 Snow monitoring using snow/atmosphere models
Simulations of satellite observed brightness temperatures requires an integrated model, combining the emittance of the surface with the characteristics of the atmosphere. This section will
give an example of monitoring snow cover extent from space, using the surface - atmosphere
model described before.
The test site selected for snow retrieval is the Hardangervidda in southern Norway. The area is
a plateau at an altitude of 1200 - 1400 m with some tops up to 1600 m. The basin of this plateau
is controlled by dams and used for hydro electric power. Knowledge of the amount of water in
the snow in the basin is of vital interest for the Norwegian state power board (Statkraft). So far
this snow information is gathered by in situ measurements and estimates from AVHRR images.
Meteorological information is provided by the Norwegian meteorological service (DNMI).
Simulation of the emittance by the snow covered land surface is done following the model
described in section 21.3.1.1. Snow data measured by Statkraft on 11th April 1988 at the
station Dyratjonn in the north of the Hardangervidda are used as inputs for the emittance
model. Meteorological data from local observations at the same time are used to describe the
atmosphere. The input parameters as used in this emission simulation are summarized in Table
21.10.
The results of the simulation are shown in Fig. 21.9 and compared with SSM!I observations.
It can be noted that the observed brightness temperature polarization difference for the 19
GHz channel (P D l9 ) is in the order of 30 to 35°K, whereas the simulated temperatures have a
P DI9 of less than 20°K. Second, the gradient for the spectral difference of the 37 and 85 GHz
channels (SD37/ 8s ) has a negative value for the emission simulation which is slightly higher than
the observed vertical gradient and opposite to the positive gradient for the observed horizontal
TB •
A more detailed analysis was carried out to quantify the contributions from the snow parameters
and those related to the atmosphere.
Meteorological data from February to April 1988 measured by the DNMI station on the Hardangervidda (Table 21.11) are used as input parameters for a detailed atmosphere.
The simulated brightness temperature as shown in Fig. 21.10 leads to the following conclusions:
If no precipitation occurs, the 19 GHz channel is only slightly affected «5°K). For the gra-